Environment
Reflection Suite for X version 14.x
Situation
If you are experiencing a problem while running X clients, you can use the Reflection X Trace utility to capture the X protocol communication to a file. The resulting trace file can then be used to help pinpoint where the problem is occurring. This technical note explains how to capture, replay, and filter Reflection X trace files, and provides instructions for uploading a trace file to Technical Support if necessary.
Resolution
Capturing the Correct Information
The most critical aspect of creating a trace is capturing the problem event. To ensure that you capture the problem event in your Reflection X trace, note the following:
- Be sure to start the Reflection X Trace utility before initializing the Reflection X connection. Although not required, this step helps assure that all data related to the problem is captured in the trace. (In some instances, it may be necessary to start the trace after initializing the Reflection X connection and setting up the problem scenario.)
- If you will be sending the trace to your company support staff or to Technical Support, replay the trace to verify that the correct information was captured (see the Replaying a Trace section below).
Creating a Trace File
To capture the problem event, follow the steps below.
- Start Reflection X. Do not connect to your host.
- Click Tools and then click Client Trace to display the Reflection X Trace dialog box.
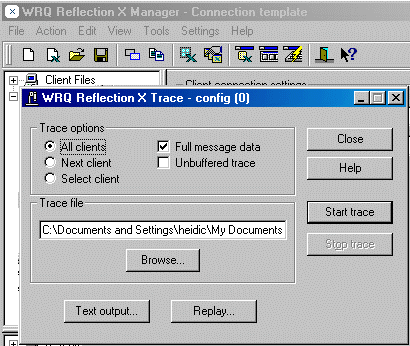
- Select a client trace option:
- All clients - Traces all the X clients that are currently running and any that you launch after choosing Start Trace. When taking a trace for an X client running in a remote window manager (for example, CDE), use this option.
- Next client - Traces only the client that you start after choosing Start Trace.
- Select client - Traces a single client that is already running. This option does not allow you to replay the trace because it cannot capture all the setting information.
- Enter a name for the trace file *, or accept the default, xscope.trc.
* Note: If you are working with Technical Support, use your service request number for the file name (<service request number>.trc).
- Select the Full message data check box.
When generating a trace, it is advisable to capture all available data by selecting the Full message data check box. This is the default value and creates a large binary file to which you can then apply different filters when reviewing the trace (see the Filtering a Trace section below).
Note: If you are troubleshooting a problem where interaction with an X client is causing Reflection X to freeze, select Unbuffered trace instead of Full message data.
- Click Start Trace.
- Start the X client(s) you want to trace and perform the steps you want captured.
- Click Stop Trace.
- Replay the trace to verify that you have succeeded in capturing the problem. For details on replaying the trace, see the following section.
Note: If you do not see the problem when you replay the trace, retake the trace.
Replaying a Trace
The trace file you create is a binary file that can be replayed on any compatible machine with Reflection X installed. You can review this file, or the file can be sent or uploaded (binary format) to your company support staff or to Attachmate's Technical Support team. Support personnel can then replay the trace locally and see firsthand the problem you are experiencing.
Before sending a trace, replay the trace to confirm that you have captured the connection information. If you cannot see the problem when you replay the trace, re-generate the trace, making sure that you start the trace before you make your Reflection X host connection.
Follow the steps below to replay the trace.
- On the Reflection X Trace dialog box, click Replay. You will now see the Reflection X Replay dialog box.
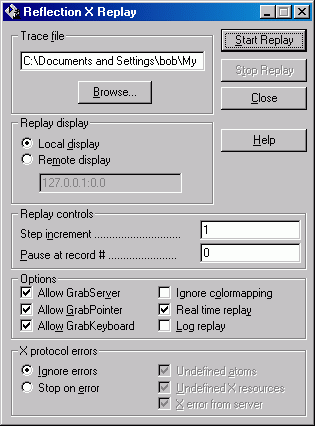
- Enter the path and name of the trace file to replay.
- Select any appropriate Options and X protocol errors. Some useful options are:
- Real time replay - Plays back the trace with approximately the same time as the original capture. This is helpful when resolving timing issues.
- Stop on error - By default, the replay will ignore errors, but if you can't pinpoint the problem, select this option.
- Ignore colormapping - By default, the replay will not ignore colormapping to accommodate the different colormappings from machine to machine. If you want to closely reproduce the color state of the server, select this option.
Filtering a Trace
When viewing the trace file, use the filters provided with Reflection X, or design your own, to specify which pieces of X protocol you want to view.
| Use this filter |
To trace |
| All.flt |
All requests, replies, events, and errors |
| Colors.flt |
Color requests, replies, events, and error names |
| Draw.flt |
Drawing requests, replies, and events |
| Errors.flt |
Errors only |
| Fonts.flt |
Font requests, replies, and error names |
| Input.flt |
Input requests, replies, events, and error names |
| Keyboard.flt |
Keyboard requests, replies, events and error names |
| Mouse.flt |
Mouse requests, replies, events, and error names |
| Selectxn.flt |
Selection and property requests, replies, events, and error names |
| Windmgr.flt |
Window manager requests, replies, events, and error names |
| Window.flt |
Window requests, replies, events, and error names |
Follow the steps below to process and filter a trace:
- In the Reflection X Trace dialog box click Text output.
- In the Reflection X Trace Convert to Text dialog box select an output filter.
- Click Convert to process the trace and to create an associated text file. You can process the same trace file several times, choosing different filters.
- Click View to view the contents of the filtered trace file.