Environment
Situation
Background
The session server plays a central role in Verastream Host Integrator (VHI) installations. The following information provides a working knowledge of how the session server responds to load and uses available resources. This information can be used to calculate basic sizing and performance for specific applied scenarios. Results in your environment may vary. Attachmate recommends that you conduct performance testing with your particular combination of model(s), host(s), host application(s), network, server hardware, and server configuration to optimize your environment and meet your quality of service (QoS) requirements.
Definitions
The following terms are used in this document:
- Model: Representation of a host application screens (entities), navigation, and data flow that you build with the Design Tool and deploy to the runtime session server.
- Active session: An active session on the session server is connected to the host and in use by a client (such as a web application or web services SOAP client).
- Idle session: "Inactive" or "idle" sessions on the session server are connected to the host in a session pool, but are not currently in use by a client/user. They are readily available for use by a client (that "connect to session"), thus reducing overhead and latency for new client requests.
- Server maximum concurrent sessions: Total peak number of simultaneous sessions (active, idle, rogue, and suspended) that can run on a session server.
- Pending session: An active or idle session that is in the process of connecting to the host. In server and pool properties, you can configure the maximum pending sessions (connecting to the host simultaneously) in order to throttle initialization activity and minimize host impact.
- Procedure: A table procedure (in the model) defines input and output parameters for retrieving or updating host data, typically navigating across multiple host screens, scrolling recordsets, etc. These procedures automatically become available web service operations.
- Event handlers: Optional custom server-side scripting (using either Java or .NET) in the model to address unique host application behavior or special requirements that override or augment standard Design Tool features (for example, data conversion or reformatting).
- Model debug messages: Diagnostic tool for troubleshooting modeling and host issues with minimal runtime performance impact. These "reports" are created with .vmr file names (see also KB 7021543).
- Session server logging: Message log on the session server for troubleshooting issues. The default logging level is errors only. (See also KB 7021303.)
Resolution
Runtime Performance and Requirements
This section describes session limits, memory usage, and other performance variables.
Concurrent Sessions
When determining session limits for specific scenarios, consider the following factors:
- Peak concurrent active sessions: The recommended maximum limit is 1000 concurrent active sessions per session server. The default maximum concurrent sessions is 5 for Development Kit or 10 for Server Kit. (Server configuration in Administrative Console accepts up to 5000 maximum concurrent sessions.)
Note: Regardless of session server capabilities, your concurrent session limit is governed by your product licensing. Do not configure more concurrent sessions than authorized by your license.
When estimating the peak number of concurrent clients, consider the expected lifespan of active sessions. Models designed for transactional use (table procedures) typically execute quickly. However, concurrent session demands are higher when using rejuvenation, suspended sessions (including stateful web services), or procedures that will take a long time to execute due to high-latency hosts or networks, encrypted communications, or navigation across a large number of entities.
To monitor the actual runtime peak concurrency ("high water mark"), see KB 7021568.
- Maximum pending sessions: In order to protect the host from a large number of sessions connecting simultaneously (such as when pools are started), we recommend that you configure the maximum pending sessions to 100 or less.
- Client connections initiated simultaneously: When client applications are connecting to session pools with sufficient idle host sessions, the recommended limit is 250 client connections activated in unison. Session pools with sufficient idle host sessions provide significant performance improvement by reducing overhead when client applications connect.
- Idle sessions: Since idle sessions typically have a low impact on CPU usage and network bandwidth, there is no specific recommended limit, but Attachmate recommends conducting on-site tests if there is a large number of inactive sessions and/or the pool startup entity requires use of a keepalive operation. Processing can be further reduced by increasing the idle pooled session entity check interval and/or model keepalive timeout (default 120 seconds).
- Multi-server scalability: Higher concurrent session requirements can be met with multiple session servers, thus distributing session load across multiple separate systems. For more information on load distribution, see Technical Notes 10108 and 10059.
Memory
The session server is highly efficient in memory usage, but does have specific needs related to model size and concurrent session count:
| Minimum required memory (no model loaded) | 512 MB |
| Suggested minimum memory with model of 50 entities, and 100 maximum concurrent sessions | 1 GB |
| Sample additional memory for each additional 100 concurrent sessions | +64 MB (+128 MB recommended) |
| Session server maximum memory use | 2 GB |
Note the following:
- With more entities in a model, more memory is consumed per session. Although there can be wide variations in the complexities of entities (operations, patterns, recordsets, and event handlers), these attributes do not have a large impact on the memory consumption per entity. A model with 100 entities uses roughly twice the memory compared to a model with 10 entities. Example: With 200 concurrent sessions, a 10-entity model uses less than 85 MB of memory, and a 100-entity model uses 161 MB.
- As active sessions navigate more host screens, memory use increases.
- System memory beyond the above requirements does not increase server performance.
Other Performance Factors
Additional configuration options and other variables can affect performance, as described below:
- Model size: Use of large or small models has little measurable effect on performance.
- Model debug messages: Model debug messages are engineered to minimize performance impact, since they are initially written to memory and saved to disk upon change in session state. Recording "everything" typically results in a small (2% to 10%) performance impact. Recording for errors only (recommended) results in negligible impact in a normal environment.
- Log all messages: The default logging level is errors only. If informational messages are added to the session server logging (Log All Messages), the increased disk write activity constrains session server runtime performance.
- Encryption security: Performance is affected by enabling encryption in the client-to-server and/or server-to-host communication. When encryption is enabled, performance may be limited by client, server, or host hardware capabilities due to encryption/decryption processing demands. For example, in laboratory tests, client-to-server encryption added 50 to 100 milliseconds to client connection time, increasing with higher concurrency loads.
- Event handlers: Model event handlers can increase CPU usage and impact performance, depending on the size, complexity, and quantity of event handlers. See also Event Handler Best Practices at http://docs2.attachmate.com/verastream/vhi/7.1/en/topic/com.attachmate.vhi.help/html/reference/event_handler_design.xhtml. In laboratory tests, Java event handlers perform faster on Linux than on Windows (especially with lighter concurrent session loads), and Java event handlers on Windows are faster than .NET event handlers (especially with heavier concurrent session loads).
- Hardware processors: Modern processor speeds and architectures are well-suited to the demands of even high concurrency loads. In laboratory tests using a session server system with two quad-core CPUs (2.66 GHz) running Windows, activity load must approach or exceed 3000 host screens per second before CPU usage exceeds 70% (using a model without event handlers). Nonetheless, we suggest you track CPU utilization in your own environment when conducting performance tests and considering scalability.
- Virtualization and 64-bit platforms: VHI operates efficiently on both 32-bit and 64-bit operating systems and on virtualization platforms with minimal differences in performance. (See also Technical Notes 10030 and 2380.)
- High latency environments: For best results, the session server should be located physically near the host(s) and on healthy high-speed networks. International, congested, or low-bandwidth network links (or heavily-loaded hosts) can constrain server performance, and may increase concurrency requirements.
Test Results Data
The tables below include the following measurements:
- Concurrent Clients: This value represents the number of client threads, and peak number of concurrent clients connecting in unison.
- # of Transactions: This value represents the total number of client connections, and total number of table procedure transaction requests.
- Time (sec): Total time (in seconds) to complete the number of procedure transactions, as measured from the client end.
- Transactions / sec: Number of transactions executed per second (calculated average run rate).
- Screens / sec: Number of entities traversed (screens navigated) per second (calculated average run rate).
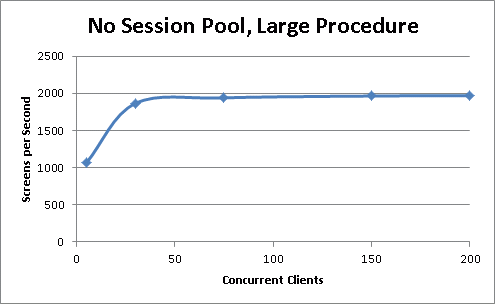
No Session Pool, Large Procedure (Test R1a)
This test measures server performance of the Search procedure without any session pool, thus the concurrent client connections and host sessions are both started in unison. Maximum performance is 1,950 to 2,000 screens per second.
| Concurrent Clients |
5 |
30 |
75 |
150 |
200 |
| # of Transactions |
500 |
3000 |
7500 |
15000 |
20000 |
| Time (sec) |
15.5 |
53.1 |
127.6 |
252.0 |
335.5 |
| Transactions / sec |
32.2 |
56.5 |
58.8 |
59.5 |
59.6 |
| Screens / sec |
1062 |
1865 |
1939 |
1964 |
1967 |
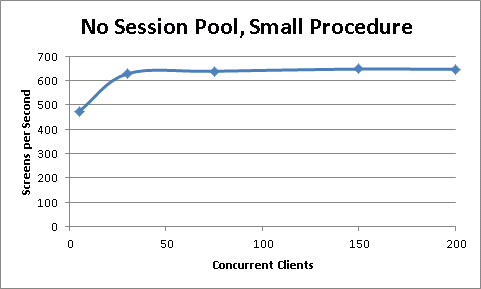
No Session Pool, Small Procedure (Test R1b)
This test measures server performance of the Update procedure without any session pool. Maximum performance is 640 to 650 screens per second.
| Concurrent Clients |
5 |
30 |
75 |
150 |
200 |
| # of Transactions |
500 |
3000 |
7500 |
15000 |
20000 |
| Time (sec) |
9.5 |
43.0 |
105.8 |
208.6 |
278.7 |
| Transactions / sec |
52.7 |
69.8 |
70.9 |
71.9 |
71.8 |
| Screens / sec |
474 |
628 |
638 |
647 |
646 |
Session Pool, Large Procedure (Test R2a)
This test measures performance of the Search procedure with a session pool. For all tests using pools, the pool is configured for 100 initial idle sessions, 10 maximum pending sessions, 500 maximum idle sessions, and 5000 maximum concurrent sessions. The relatively low pending sessions may have the unintended consequence of throttling server performance in scenarios with greater than 100 concurrent client connections. Nonetheless, maximum performance is considerably higher with pools at about 6,000 screens per second, or about 3 times higher than non-pooled.
| Concurrent Clients |
5 |
30 |
75 |
150 |
200 |
| # of Transactions |
500 |
3000 |
7500 |
15000 |
20000 |
| Time (sec) |
8.4 |
15.1 |
35.7 |
71.7 |
92.7 |
| Transactions / sec |
59.7 |
198.7 |
210.0 |
209.2 |
215.7 |
| Screens / sec |
1672 |
5564 |
5881 |
5858 |
6038 |
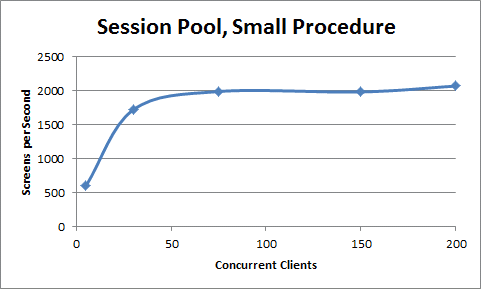
Session Pool, Small Procedure (Test R2b)
This test measures performance of the Update procedure with a session pool. Pooled performance is about 2,000 screens per second, again more than 3 times higher than non-pooled.
| Concurrent Clients |
5 |
30 |
75 |
150 |
200 |
| # of Transactions |
500 |
3000 |
7500 |
15000 |
20000 |
| Time (sec) |
3.4 |
7.0 |
15.1 |
30.4 |
38.8 |
| Transactions / sec |
148.3 |
428.0 |
495.5 |
493.8 |
515.3 |
| Screens / sec |
593 |
1712 |
1982 |
1975 |
2061 |
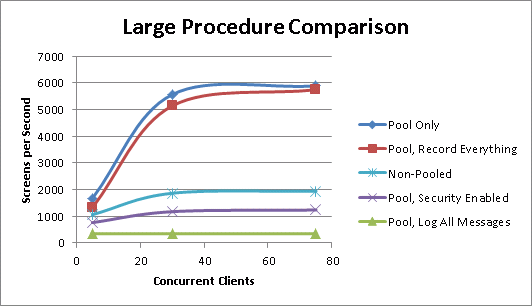
Large Procedure Comparison (Tests R1a, R2a, R3a, R4a, and R5a)
The following tests summarize performance of the Search procedure under different scenarios. Key results:
- Model debug messages (recording everything) has minimal performance impact due to its high-efficiency design with minimal disk write activity.
- Pools produce a significant performance increase compared to non-pooled connections, due to pre-connection of host sessions.
- Enabling security between the client connector and session server adds overhead, due to the processing of client credentials authentication, client user authorization by the management server, and SSL encryption and decryption. Depending on your load demands, security may increase the need to use multiple servers for scalability.
- Configuring the session server logging to log all messages produces the slowest performance due to high disk write activity. Thus, this configuration is recommended for only temporary use while troubleshooting.
| Concurrent Clients |
5 |
30 |
75 |
| Pool Only |
1672 |
5564 |
5881 |
| Pool, Record Everything |
1323 |
5137 |
5741 |
| Pool, Log All Messages |
347 |
345 |
345 |
| Pool, Security Enabled |
763 |
1172 |
1233 |
| Non-Pooled |
1062 |
1865 |
1939 |
Additional Information
Test Methodology
If you are interested in how Attachmate testing labs measures performance, the following information describes the testing environment and methodologies.
Testing Environment
Tests were performed with the client, server, and host on separate systems on a 100 Mbps network.
 Figure 1. Test systems
VHI Server Hardware
| Model | Dell PowerEdge R410 |
| CPU | 2 x XEON E5430 @ 2.66 GHz (two quad-core CPUs) |
| Memory | 24 GB |
| Hard Drives | 300 GB @ 15K RPM |
| Operating System | Microsoft Windows Server 2003 R2 Enterprise x64 |
Server Configuration
| Maximum Concurrent Sessions | 5000 (both server and pool properties) |
| Server Maximum Pending Sessions | 500 |
| Pool Maximum Pending Sessions | 10 |
| Pool Initial Idle Sessions | 100 (except not applicable for non-pool tests) |
| Pool Minimum Idle Sessions | 1 (except not applicable for non-pool tests) |
| Pool Maximum Idle Sessions | 500 (except not applicable for non-pool tests) |
| Host Session Threads | 8 |
| Model Debug Messages | Record Nothing (except Record Everything for test R3) |
| Default Logging Level | Log Errors (except Log All Messages for test R4) |
*For tests using the session pool (all tests except R1 and S1), the initial host sessions are pre-loaded, including completion of successful navigation to the home entity, before the test is initiated.
Models
Tests were performed with the following VHI models.
| Model R | |
| Number of entities | 13 |
| Number of screens traversed to home entity | 5 |
| Number of screens traversed in Search procedure | 28 |
| Number of screens traversed in Update procedure | 4 |
| Model S (scripted) | |
| Number of entities | 13 |
| Number of screens traversed to home entity | 5 |
| Number of screens traversed in Search procedure | 28 |
| Number of screens traversed in Update procedure | 4 |
| Number of event handlers in Search procedure | 200 |
| Number of event handlers in Update procedure | 40 |
Client Application
The test client is a multi-threaded application (Apache JMeter) that establishes multiple concurrent connections to the session server using the VHI Java Connector, running on Windows. The client requests execution of a Search procedure (resulting in model traversal of 28 screens) or an Update procedure (4 screens). Each client thread executes the procedure 10 times. For example, if the test is run with 100 clients, a total of 1000 transactions are executed. The client thread disconnects and re-connects between each transaction request, thus each transaction is handled with a separate client connection.
Host (Trace Player)
The host is emulated by Trace Player, an Attachmate utility. This utility is not provided with the product. For more information about Trace Player, contact Technical Support at https://support.microfocus.com/contact/.
Trace Player 3.22 was used with the following parameters:
| Port Number | 1100 |
| ThreadPoolSize | 20 |
| TimeoutMinutes | -1 (infinite) |
| AutoMode | MAINFRAME |
| MF Negotation | NEGOTIATE_0 |
| MF Initialization | BLOCK0 |
| FileCache | true |
| Lag | 250 |
| LagPercent | 0 |
| MaxClients | 20000 |


