Summary
A workaround is provided to visualize the data in the “Transaction Response Time Under Load” graph in LoadRunner Analysis 11.52 patch 1
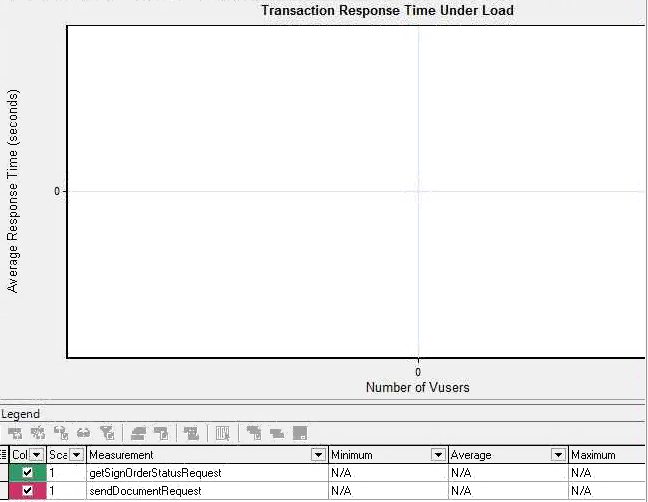
Error
After adding a new “Transaction Response Time Under Load” graph in a LoadRunner Analysis 11.52 patch 1 session, no data is displayed:
Cause
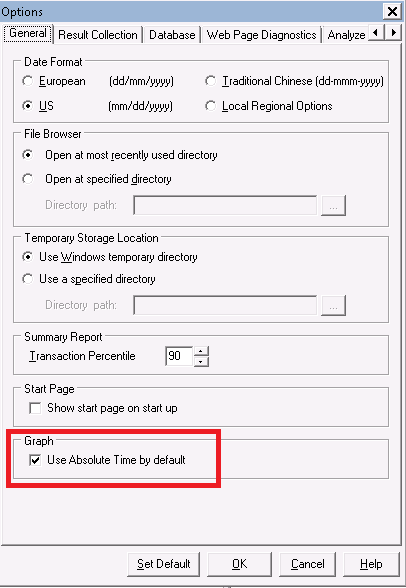
No data may be displayed if the “Use Absolute Time by Default” option is selected in
Tools -> Options -> General -> Graphs
Fix
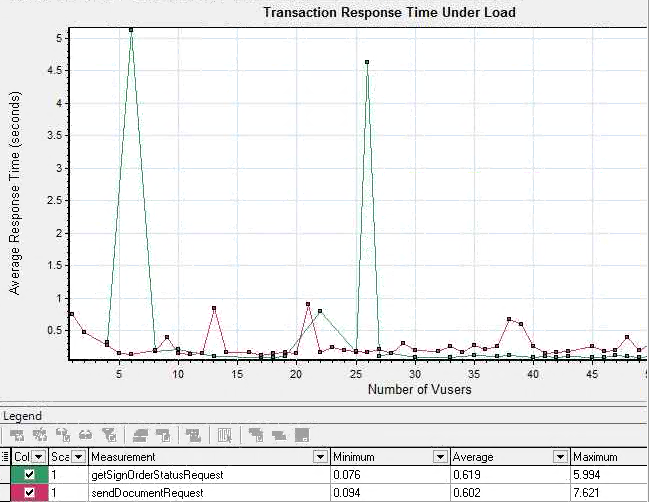
The graph data may be displayed by:
-
Right clicking on the graph and selecting “Clear Display Options”
or -
Unchecking the “Use Absolute Time by Default” option in
Tools -> Options -> General -> Graphs and then
adding the “Transaction Response Time Under Load” graph
After the data in the graph is displayed, the current analysis session can be saved as a default template using the Apply/Edit Template option available from the Tool->Templates menu.