Environment
GWAVA (Secure Messaging Gateway) 7
Situation
After SMG has crashed, what is the best way to view the backtrace?
Resolution
Before the backtrace can be viewed, make sure the server is set to create a dump file when it crashes. Here is a TID
on how to do that. In order to view the backtrace, follow these steps:
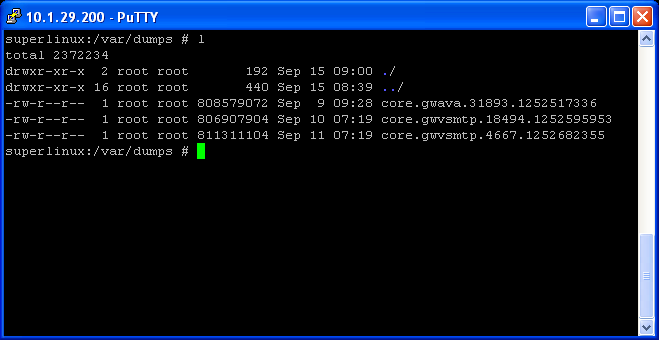
1) Open a SSH terminal to the SMG server. Log in as the gwava user and then switch to the root user by typing: sudo su (then the password for the gwava user, when prompted).2) Browse to the directory that was created to put the dumps files in by typing: cd /var/dumps3) Type ll (two lowercase L's) to see the most recent Core Dumps. Find the core with the date and time closest to the present time.4) Type gdb /opt/gwava/assets/bin/linux/x64/(process) /var/dumps/core.(process).(core number). Depending on the program that crashed, use the correct process. Example: If gwvsmtp crashed, type gwvsmtp after the ../assets/bin/linux/x64.5) To view the backtrace type: btThe data after typing 'bt' is what support needs to try and figure out why it crashed. Here's an example:6) Type quit to exit.