Environment
Situation
Resolution
If an SMG module crashes it is extremely useful to engineering if the backtrace of the program that crashed, can be obtained. This information usually provides details of exactly where the code failed, and often also indicates why it failed. Providing this information to engineering can drastically reduce the time it takes to resolve these disruptive problems.
Step 1: Find the startup command for the module
There are a couple of methods of determining the command required to run the module that is to be tested.
Method 1
The easiest way is to check the process list to see how the existing program was run. This method requires the module to be running, so it is appropriate to use when crashes are intermittent and the module is still running.
At a terminal prompt, type the following command: ps ax | grep modulename
The following example shows how to get the module details for the gwvsmtp module.

From this information, the line portion we will be using to start the debugging session is:
/opt/gwava/assets/bin/linux/x64/gwvsmtp "/root=/opt/gwava/" /ServerId=1 /ModuleId=1
Method 2
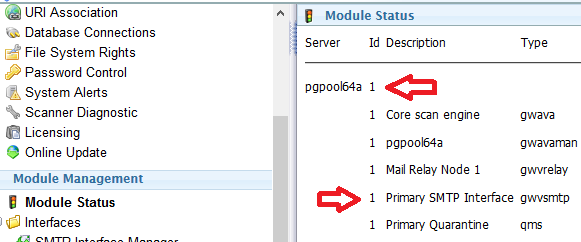
In cases where the module is unable to start, or is going up and down erratically, the necessary startup switches can be found in the admin UI under the module management page.
In a multi-server environment, make sure you are referring to the correct server when obtaining these id numbers. The server id is listed beside the server in the top row and the module ids are listed for each module on the server.
The format of the command line is as follows:
/opt/gwava/assets/bin/linux/x64/gwvsmtp "/root=/opt/gwava/" /ServerId=[server id] /ModuleId=[module id]
Step 2: Shutdown the module to be tested
This step is crucial to save the headache of dealing with modules trying to automatically reload.
If possible, shut down the program either with the modules UI page, or by sending a kill command to the module from a terminal window. If the kill command is used, it MUST NOT be used with the -9 switch, as this will not allow the module to stay down.
If shutting down the module is not possible, typically due to a crash/restart loop, disable the server setting for 'Module auto-recovery' under the Manage Servers UI page. With this setting disabled, the program will not come back up by itself. It is important to remember to re-enable this option when the back trace has been obtained.
Step 3: Ensure gdb is installed
To get the debug information, gdb is required, but it not installed by default.
Type 'gdb --help' at the terminal prompt to check that it is installed.
If the help page is not displayed, install gdb by typing 'apt install gdb'.
Step 4: Run the module in debug mode
Using the startup command determined in step 1, we can now prepare to start the application. Using the examples from step 1, and assuming the module we are investigating is gwvsmtp, enter the following commands, noting the additional switch that has been added to the end of the line:
cd /opt/gwava/assets/bin/linux/x64
gdb --args /opt/gwava/assets/bin/linux/x64/gwvsmtp "/root=/opt/gwava/" /ServerId=1 /ModuleId=1 /ConsoleLog
After typing these commands you should be placed into the gdb program at a (gdb) prompt which is ready to run the application. Type 'r' to start the program.
Step 5: Watch and wait
Now that the program is running, it is simply a matter of waiting for the crash to occur. The /ConsoleLog switch that was included on the command line will be echoing to the terminal display. This is the same log information that is stored in the application logs. By emitting it during the debug session, we are able to capture the end of the log along with the debug information which saves on the effort of matching log files to the information we are after.
Leave the program running until it stops. This will be evident when the log stops scrolling and you are given a prompt to type at.
Step 6: Obtain the backtrace
Once the program fails, type 'bt' at the prompt. This will provide a set of lines that include the information that's useful to engineering.
Scroll back up through the information to where the logging information ends. Copy the text from approximately one screenful of logging information down to the end of the backtrace information. Pay attention to what's in the log information and if it seems that more may be useful, copy as much as seems necessary. It is better to capture more information than less if you are unsure of what you are reading. Using the time on the log can also be a useful way to determine what might be necessary. If there are four pages of log data within the same second, chances are that's all going to be related.
The information should look something like this:

Step 7: Clean up
To exit gdb, enter 'q'. This will return you to the terminal prompt.
If Module auto-recovery was disabled, re-enable it on the Manage Servers page.
Restart the programs using the appropriate method for the system you are working on.
Step 8: Provide the information to engineering
Self explanatory. Add the information to the bug ticket, or via email to the engineer that requested the information.