Environment
Redline 2.5x, 3.x
Netware or Linux
Netware or Linux
Situation
Adding Gauges, Graphs, and Status Values to the Redline Dashboard
Resolution
By default Redline has many different gauges, graph, and values on the home dashboard of the web interface. Many admins desire to have specific values placed on the dashboard. Many other values are built in and ready to use. Others can be customized. To use the values not seen, do the the following:
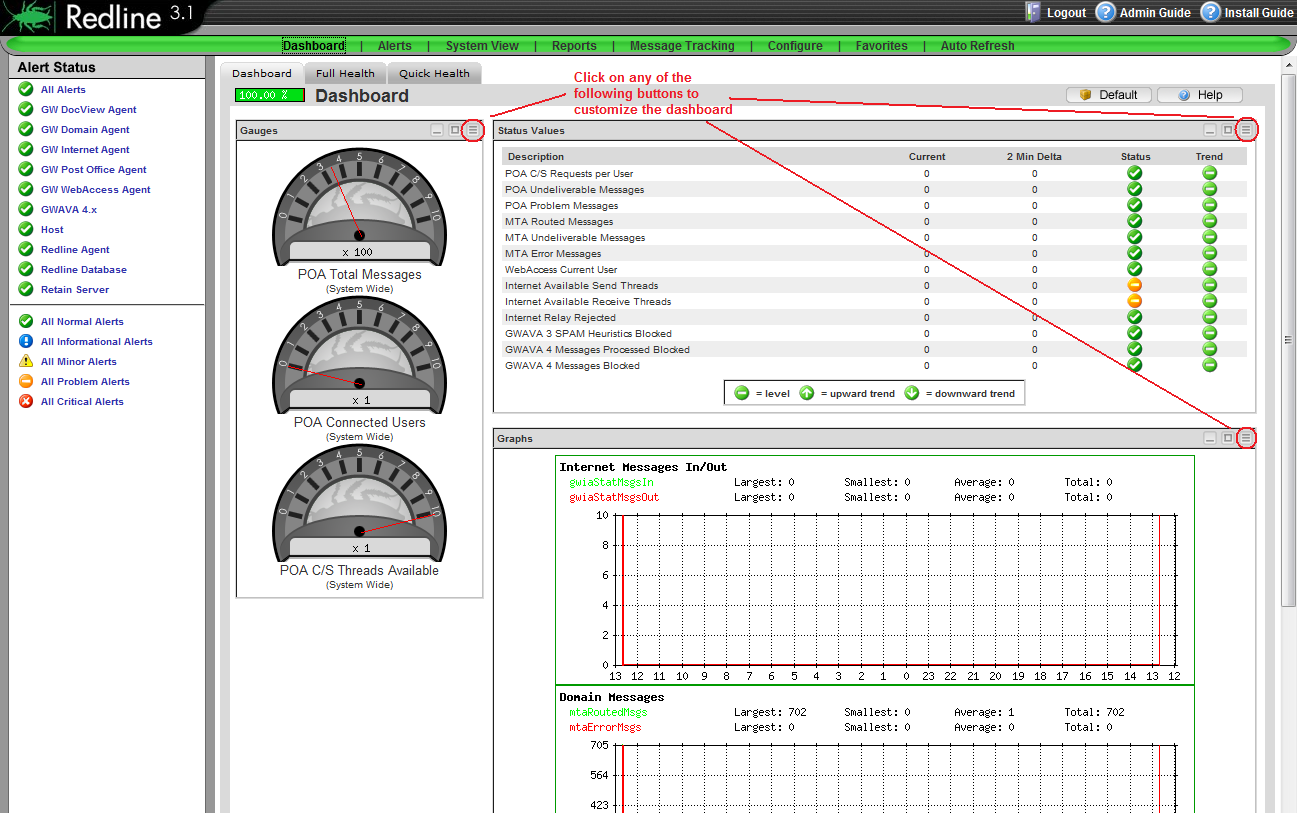
1. Open browser, and login to the Redline Control Center Web User Interface.
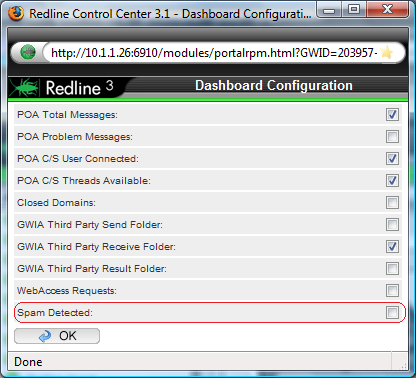
2. On the dashboard, notice the sections for Graphs, Gauges, and Status values. They are surrounded by a window boarder. There are three buttons to minimize, maximize, and configure. Select Configure Window.
3. A new window will open. Simply select the values desired. Click OK.
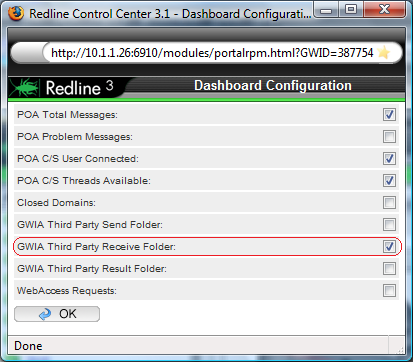
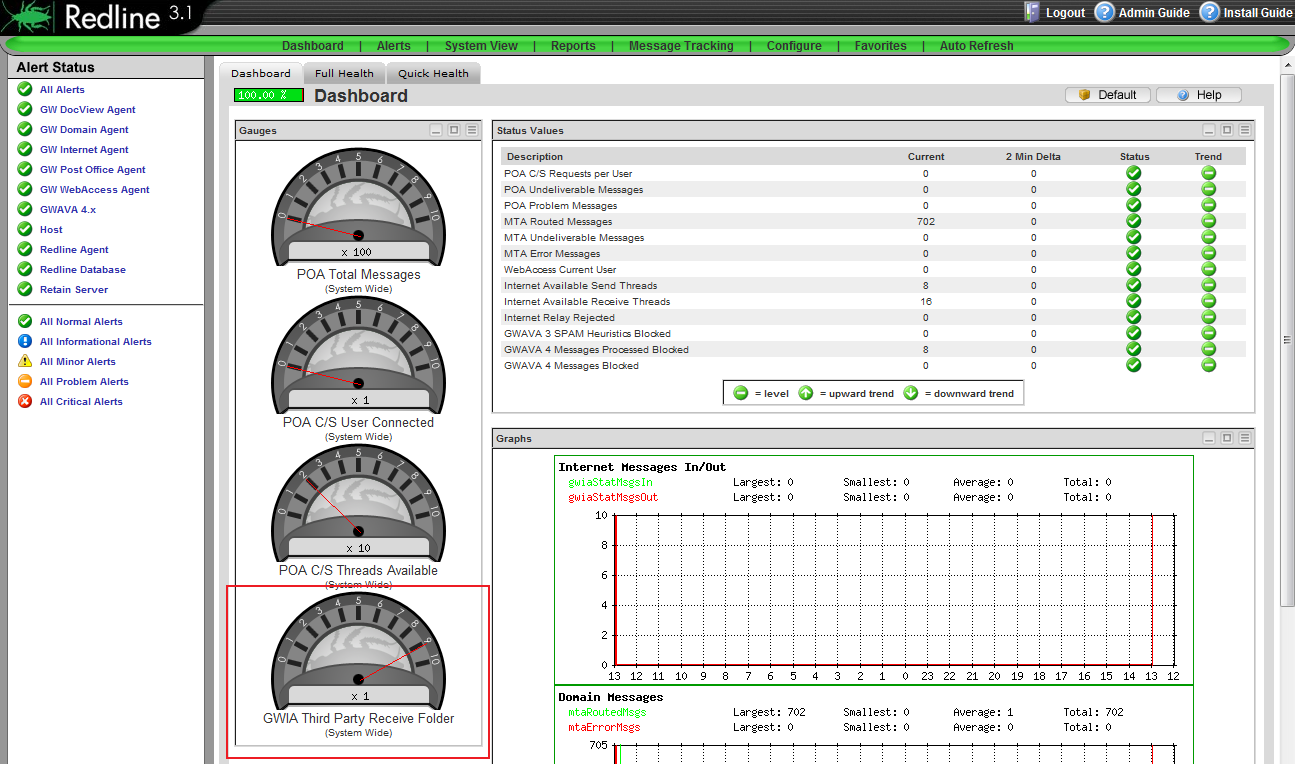
4. Refresh the dashboard page.
ADVANCED USERS - What if the value you wish to monitor is not in the default selection? There is a way to add more values to the Graphs, Gauges, and Status Values.
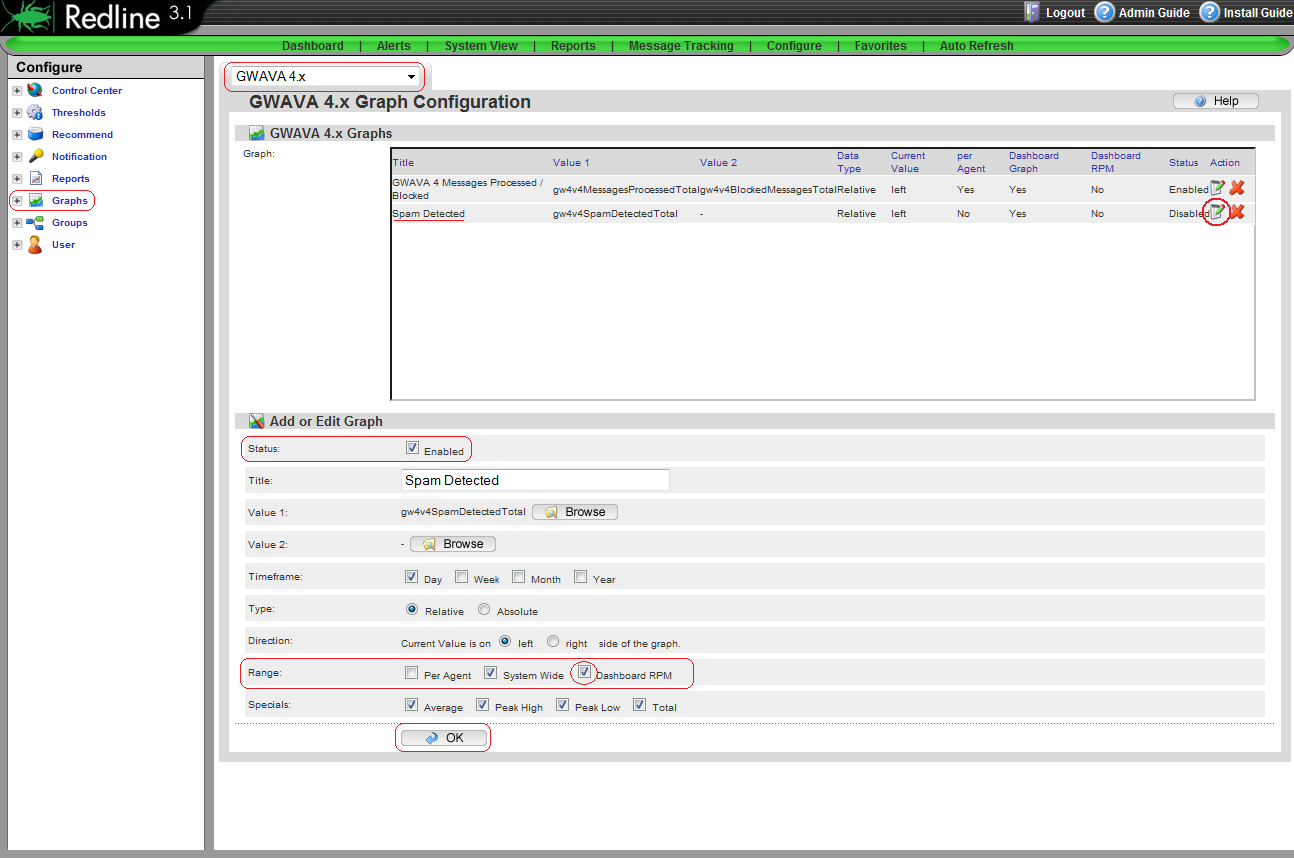
1. Click on Configure, and then Graphs (on the left hand side of the screen)
2. Select from the pulldown, the monitored agent that is desired.
3. Select one of the available values in the graph box by clicking the small notepad icon to the right of it.
4. Once loaded, simply check the Enable section, and under the range row, select Dashboard RPM. Click OK.
5. Return to the Dashboard page and complete the first four steps of this document to enable this gauge. The newly enabled option will now be available for selection.
1. Open browser, and login to the Redline Control Center Web User Interface.
2. On the dashboard, notice the sections for Graphs, Gauges, and Status values. They are surrounded by a window boarder. There are three buttons to minimize, maximize, and configure. Select Configure Window.
3. A new window will open. Simply select the values desired. Click OK.
4. Refresh the dashboard page.
ADVANCED USERS - What if the value you wish to monitor is not in the default selection? There is a way to add more values to the Graphs, Gauges, and Status Values.
1. Click on Configure, and then Graphs (on the left hand side of the screen)
2. Select from the pulldown, the monitored agent that is desired.
3. Select one of the available values in the graph box by clicking the small notepad icon to the right of it.
4. Once loaded, simply check the Enable section, and under the range row, select Dashboard RPM. Click OK.
5. Return to the Dashboard page and complete the first four steps of this document to enable this gauge. The newly enabled option will now be available for selection.
Additional Information
This article was originally published in the GWAVA knowledgebase as article ID 380