Environment
Redline 3.x
SLES 9.3
SLES 10.x
NetWare
Situation
Browsing the Contents of the Redline Databases and Creating a Custom Report
Resolution
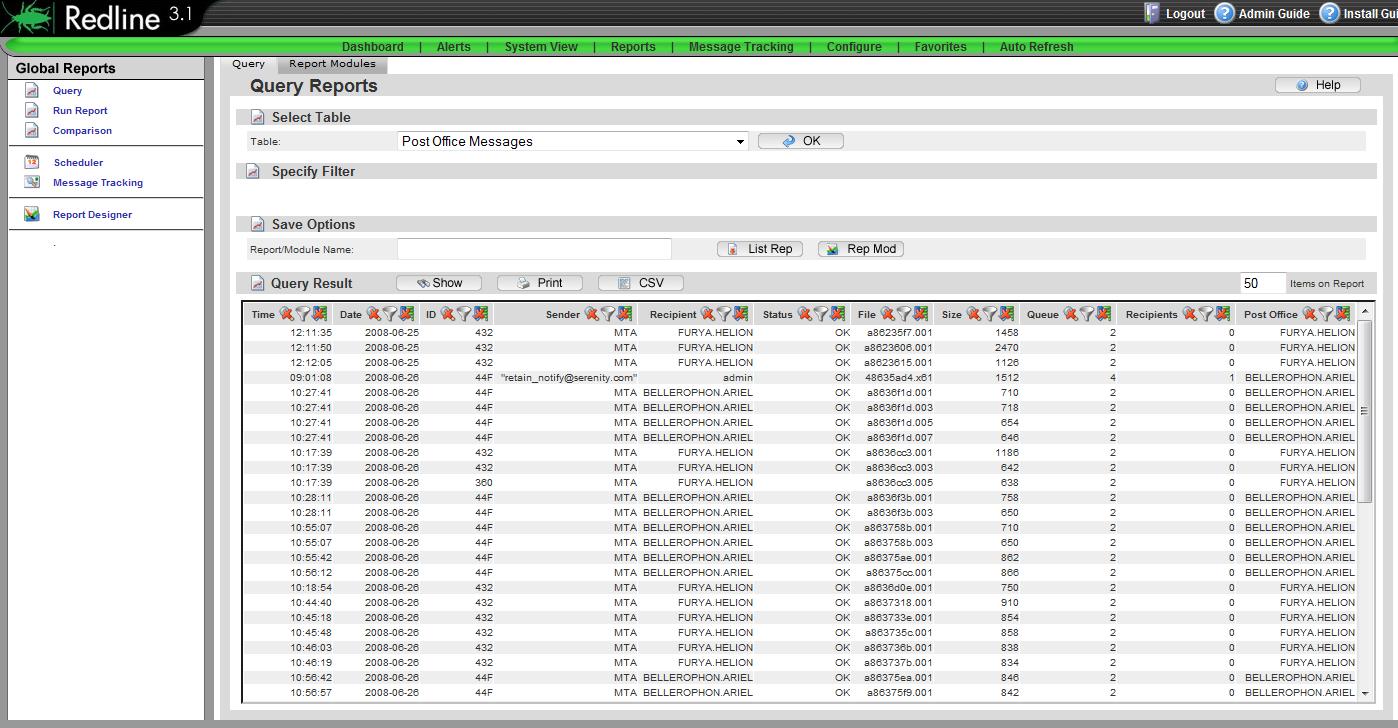
It is now possible with the latest version of Redline to browse the contents of each of the tables in Redline databases. The Redline Agents collect data from each of the monitored agents and send it to the Control Center. The Control Center consumes this received data and places it into the databases. Surprisingly it is very simple to see this data. Simply use a web browser to connect to the Redline Control Center web page, and select Reports. This should bring up the query page.
The browser allows you to select a table with which to view data. Unfortunately, it does not specify with database it is actually coming from, but it does output what is contained in that table and allows you to filter according to what you wish to view. These results can be saved for future queries or made into modules that can be added to a custom report using the report designer.
Select a Table:
First select a table to query and press OK.
Create a Filter:
You may wish to limit the output of this report to tune the results. To do this, use the filter option. To set a filter, chose a column header and click on the funnel icon.
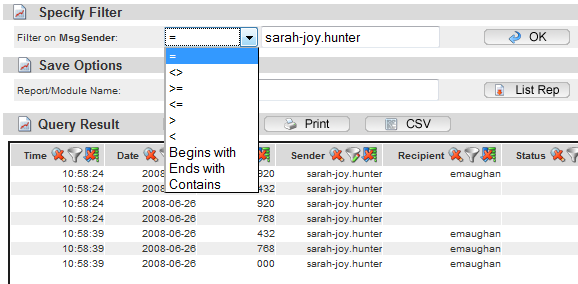
NOTE: The filter parameter is CASE SENSITIVE and DOES NOT allow wildcards. To effectively specify a working filter, you need to be able to see the query results, so you can specify a filter exactly as the result is seen by Redline. A typo will cause the filter to exclude all results.
The filter becomes active when you select the OK button and the query results are loaded.
A column with an active filter is noted by a pencil on the cone,
There may be several filters active at the same time. When several filters are active, the Specify Filter field will still only show one entry. You will need to look at the column headers filter icon (funnel) to determine which one is active. Clicking on the filter icon will show the filter.
Saving the Results:
To save your query results as a module, specify a Report or a Module name, and select the List Rep, or Rep Mod buttons. (If you select the Rep Mod button, your query will be saved as a Module which can be used to build a custom report with multiple queries, graphs, or tables. The List Rep button simply saves the query as a full report which can be run later).
The query has been successfully saved if you see the red notification in the result window, above the column headers. The query has now been saved, and can be accessed, run, or modified as the other reports. The saved query is also listed with the rest of the reports or modules under the report or module name you specified.
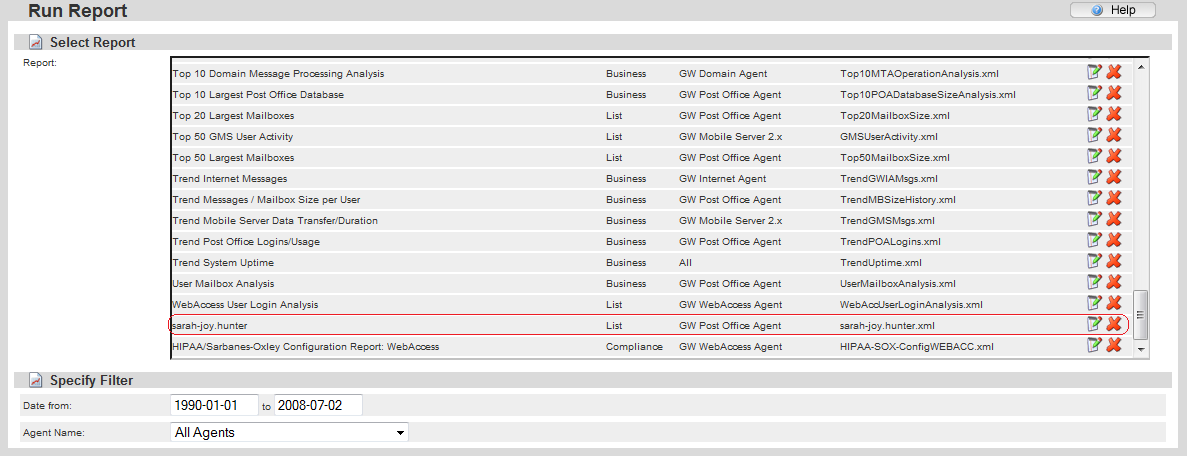
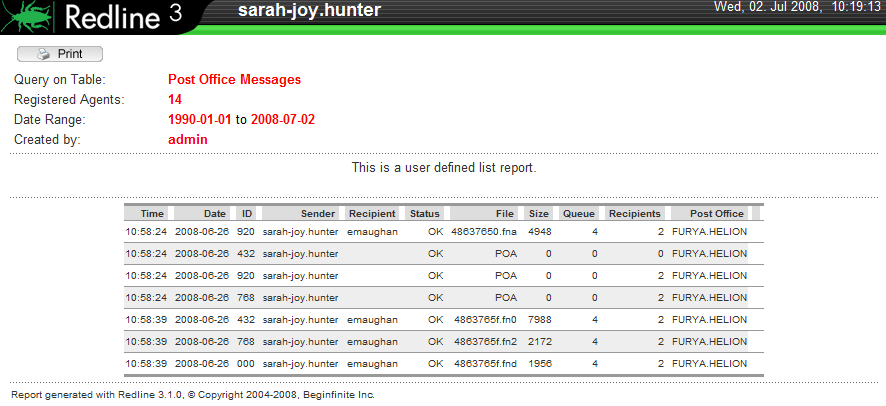
To run your custom report, select the notepad to the far right of the report name in the list. The report will be generated and displayed. To delete the report, click the "X" icon.
Additional Information
This article was originally published in the GWAVA knowledgebase as article ID 310.