Environment
GWAVA 5 Running on Windows or Linux
Situation
How can I add a new Table/Chart/Graph to the Dashboard?
Resolution
The Dashboard is new with GWAVA 5. There are several different options to choose from when setting this up. To add a new window to the dashboard do the following:
1) Go to the Dashboard by hitting the 'Home' link on the top left of the GWAVA Management Console. You can also access it by going to Home Pages | Dashboard | Welcome
2) Click on the bar at the top center of the page.
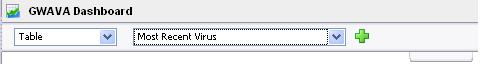
3) Using both drop down menus select the option you want. For example if you would like a Table chart of the Most Recent Virus do the following:
a) From the pull down menu on the left choose 'Table'The new table should now show up on the Dashboard.
b) From the second pull down menu choose 'Most Recent Virus'
c) Click on the green plus sign to add this table to the Dashboard.
d) Hit 'save changes' at the top right.


Additional Information
This article was originally published in the GWAVA knowledgebase as article ID 1900.