Environment
NetIQ Identity Manager 4.5
NetIQ Identity Manager Driver - Active Directory
NetIQ Identity Manager Driver - Active Directory
Situation
When the Active Directory Driver is loaded on a server, it takes the server into high utilization.
There are 4-5 drivers running on the server, and this only occurs when the Active Directory driver is loaded on the server.
If you move the driver to another server, it did not experience the same high utilization issue.
There are 4-5 drivers running on the server, and this only occurs when the Active Directory driver is loaded on the server.
If you move the driver to another server, it did not experience the same high utilization issue.
Resolution
Clearing the driver engine process cache files resolved the issue (dxXXXXX files). These are events made by the driver with out of band events. For some reason, the driver was hung upon an event or events in the cache file.
Here is how you clear the driver engine process cache files.
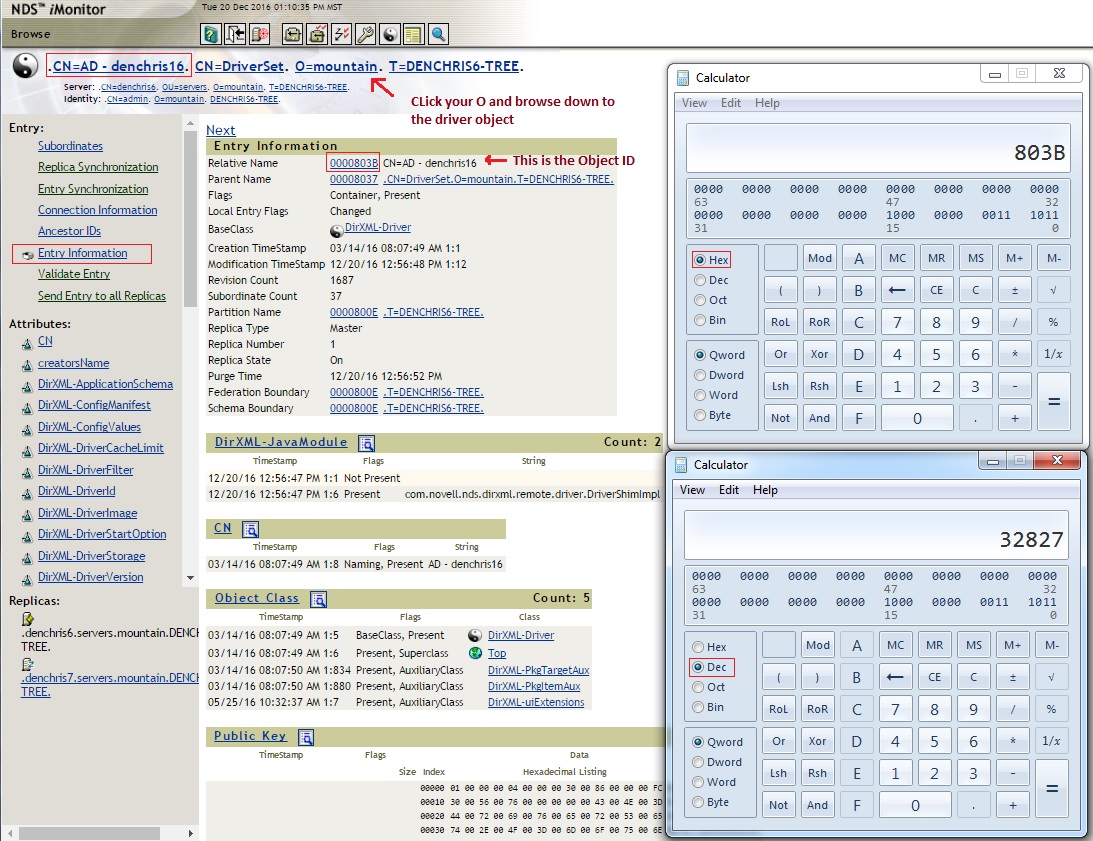
1. Determine the Driver Object ID using iMonitor on the server running the driver, then convert that into decimal form using a Hex to Decimal conversion tool like windows Calc. Note: object id's are server specific, so you need to open iMonitor on the server running the driver that is having the problem.
To do this, login to iMonitor on the server running the driver (https://IPAddressOfServer:8030/nds), browse down the tree to the driver and note the entry ID.
2. Convert the entry ID from Hex to Decimal using Windows Calc (programing view), In my case 803B converts to 32827.
3. Stop the driver.
4. Go to the eDirectory Dib directory. (/var/opt/novell/eDirectory/data/dib by default)
5. Delete the mapdb files that correlate to the driver.
There should be 4 files with that number in them. (ll *32827*)
32827.TAO
dx32827
dx32827.t
dx32827.p
Leave the .TAO in place, and delete the other three dx32827 files.
6. Start the driver.
It should recreate the files and utilization should be normal now.
You may also need to clear the driver event cache files as well (.TAO file). However, if you clear the driver event cache file and it has events in it, then you will lose those transactions and they will not be synchronized to the connected application. The easiest way to clear the .TAO file is to stop the driver, disable the driver (SAVE), then re-enable the driver. Uncheck the option to re-synchronize the driver, unless you want to sync all associated objects with the driver through the driver. Then start the driver.
Here is how you clear the driver engine process cache files.
1. Determine the Driver Object ID using iMonitor on the server running the driver, then convert that into decimal form using a Hex to Decimal conversion tool like windows Calc. Note: object id's are server specific, so you need to open iMonitor on the server running the driver that is having the problem.
To do this, login to iMonitor on the server running the driver (https://IPAddressOfServer:8030/nds), browse down the tree to the driver and note the entry ID.
2. Convert the entry ID from Hex to Decimal using Windows Calc (programing view), In my case 803B converts to 32827.
3. Stop the driver.
4. Go to the eDirectory Dib directory. (/var/opt/novell/eDirectory/data/dib by default)
5. Delete the mapdb files that correlate to the driver.
There should be 4 files with that number in them. (ll *32827*)
32827.TAO
dx32827
dx32827.t
dx32827.p
Leave the .TAO in place, and delete the other three dx32827 files.
6. Start the driver.
It should recreate the files and utilization should be normal now.
You may also need to clear the driver event cache files as well (.TAO file). However, if you clear the driver event cache file and it has events in it, then you will lose those transactions and they will not be synchronized to the connected application. The easiest way to clear the .TAO file is to stop the driver, disable the driver (SAVE), then re-enable the driver. Uncheck the option to re-synchronize the driver, unless you want to sync all associated objects with the driver through the driver. Then start the driver.
Cause
To try and track this down you can look at the processes and threads NDSD / IDM are using with the following:
The following commands need to be run on the problem server after it is showing high utilization, one after the other as swiftly as possible. Maybe open a terminal window for each command.
Repeat them 5 times changing the output filename each time and send in the files. Look at them and see if there is a common process / thread that is taking the utilization.
1. ps -C ndsd -L -o pid,tid,nlwp,pcpu,pmem,vsz,stat > /tmp/PSFile1.log>>>
2. gstack `pgrep ndsd` > /tmp/PSndsd1.log
Note: ` is not a single quote ', rather the symbol on the upper left hand corner of your keyboard under ~.
3. Using dxcmd, go to 8. Get JVM statistics and select 3. Thread statistics.
Using the PSFile1.log, you can browse down and find the thread taking the utilization
PID TID NLWP %CPU %MEM VSZ STAT
14269 12375 96 0.0 20.3 2757264 Sl
14269 6857 96 0.0 20.3 2757264 Sl
14269 26650 96 70.8 20.3 2757264 Rl
14269 26651 96 0.0 20.3 2757264 Sl
14269 26652 96 0.0 20.3 2757264 Sl
In this case it is thread 26650 using 70.8 % of the utilization
In PSndsd.log, you can browse down and see what that thread is doing.
Thread 7 (Thread 0x7f55eeea8700 (LWP 26650)):
#0 0x000000375500f133 in pread64 () from /lib64/libpthread.so.0
#1 0x00007f55f09df1fc in Java_sun_nio_ch_FileDispatcherImpl_pread0 () from /opt/novell/eDirectory/lib64/nds-modules/jre-8u92-linux-x64/lib/amd64/libnio.so
#2 0x00007f5601d80412 in ?? ()
#3 0x00000000e0b0d5c0 in ?? ()
#4 0x00007f561206df90 in Universe::_heap_used_at_last_gc () from //opt/novell/eDirectory/lib64/nds-modules/jre/lib/amd64/server/libjvm.so
#5 0x00000000e0c01988 in ?? ()
#6 0x0000000000000000 in ?? ()
In this case it is doing some io reads. pread0
In the thread statistics file you created using dxcmd, you can potentially find out more details on what that thread process is doing.
sun.nio.ch.FileDispatcherImpl.pread0(Native Method)
sun.nio.ch.FileDispatcherImpl.pread(FileDispatcherImpl.java:52)
sun.nio.ch.IOUtil.readIntoNativeBuffer(IOUtil.java:220)
sun.nio.ch.IOUtil.read(IOUtil.java:197)
sun.nio.ch.FileChannelImpl.readInternal(FileChannelImpl.java:741)
sun.nio.ch.FileChannelImpl.read(FileChannelImpl.java:727)
org.mapdb.Volume$FileChannelVol.readFully(Volume.java:946)
org.mapdb.Volume$FileChannelVol.getDataInput(Volume.java:1008)
org.mapdb.Volume$FileChannelVol.getDataInput(Volume.java:781)
org.mapdb.StoreDirect.get2(StoreDirect.java:459)
org.mapdb.StoreWAL.get2(StoreWAL.java:336)
org.mapdb.StoreWAL.get(StoreWAL.java:320)
org.mapdb.Caches$HashTable.get(Caches.java:246)
In this case the pread0 is doing some reads on mapdb, which are engine cache files the driver uses for out of band events and other things. (you really have to know what the process's are doing here to pinpoint what is the source of the issue. IDM engineering pointed out to me that the mapdb process was related to the driver engine cache files)