Environment
NetIQ Operations Center
NetIQ AppManager Operations Portal
Situation
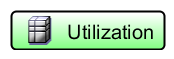
By default elements in NOC Java client layout view are being presented with small colored rectangle, where color usually presents the current condition of the element (green=OK, red=CRITICAL, ..). The rectangle also holds element's name, and an icon, providing this way some kind of characteristic of an element, like in the example below:
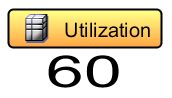
This is not bad, in fact such standardized presentation has a lot of advantages. Unfortunately, in many cases this type of presentation is not sufficient. The example above seems to describe an element with server's utilization. But where is the value? Fortunately, built-in layout editor allows us to add easily the utilization value as an extra text, for example like this:
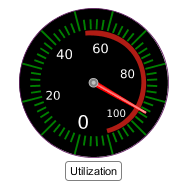
Good. But isn't this rather boring? Would not be much nicer to have here a beautiful gauge with the range from 0 to 100, showing accurately the latest utilization value?
Yes, this can be done with predefined gauge layouts NOC Java client offers, and below is step-by-step explanation how this can be achieved.
This is not bad, in fact such standardized presentation has a lot of advantages. Unfortunately, in many cases this type of presentation is not sufficient. The example above seems to describe an element with server's utilization. But where is the value? Fortunately, built-in layout editor allows us to add easily the utilization value as an extra text, for example like this:
Good. But isn't this rather boring? Would not be much nicer to have here a beautiful gauge with the range from 0 to 100, showing accurately the latest utilization value?
Yes, this can be done with predefined gauge layouts NOC Java client offers, and below is step-by-step explanation how this can be achieved.
Resolution
Let us use the scenario above. Let say we have an element which describes the utilization of a server, and updates its condition regularly. This element also has an extra property implemented, holding the value for server utilization, with the name "Value".
(If you don't have such custom element ready, you can easily create one, and for the test case you can add an extra property to it, by using a built-in functionality "Manage properties" in NOC Java client: just go to your element -> right-click -> Manage Properties... )
Now how to switch from that rather boring rectangle to an expressive gauge? Here are steps which need to be done:
1) Select your element in explorer tree view, and then go to layout tab.
2) In the graphics browser window (which opens in the lower left side) select Graphics Tab, and in Categories select Nodes -> Technology -> Gauges. List of several gauges should appear.
3) Click on the very first "ComputerMeter" gauge, and then drag and drop it to your current layout (be sure your element is still being selected!).
4) Warning window appears. Confirm with YES that you want to change the Ambient Nodestyle.
5) Your element's nodestyle gets changed, and the layout editor switches automatically into EDIT mode.
6) Grab the gauge and position / move it on your layout, at least slightly. This is very important step. If you skip this, our later change in this layout's SVG source code will get ignored, and source code will revert back to default.
7) Click on "View Source" link in lower part of the layout editor. Source editor window with SVG source code will appear.
8) Locate the following string in the SVG code:
<bind:value frequency="15" attr="transform">
This is where the script which calculates gauge's needle rotation starts, and it is useful to study this script a bit to understand how this all works internally.
Tip: you can right-click on the code and use implemented FIND, and FIND NEXT functionality.
9) Scroll down several lines below, where you can see the following line:
var randomval = element["randomval"]
This is the holder for the fake element's property "randomval", which does not exist, and therefore the gauge needle by default always points to value of 0.
10) Replace the second occurrence of the string "randomval" in this line with our custom property name, i.e. "Value":
var randomval = element["Value"]
11) Click on link "Switch to View Mode", and save the modified layout
We are done. Now you can test changing your element's custom property value, and enjoy your gauge changing the needle position accordingly (well, change must not necessarily appear immediately):