Environment
NetIQ Access Governance Suite
Situation
Although WireShark is a professional traffic protocol analysis tool, you may not have the ability or the right to utilize this tool within your network. Your IT Security department may forbid the use of such tools by policy, or restrict their use to only qualified or certified individuals.
This is not an unusual circumstance, and is rather commonplace within enterprise networks that are engaged in ensuring and minimizing risk to their data and operations. After all, allowing thousands of individuals to capture and analyze traffic flows within the network would tend to present a security risk if such data were to be obtained by the wrong individuals. In this case, there are a few other means of obtaining some traffic analysis that do not present real threats to the system overall - but can gather some useful information to determine what problems may exist locally, or what the behaviors are within your environment.
One such tool is Firebug, a developer tool that is easily added to Firefox, a widely available, cross-platform browser. T here are Lite editions for Google Chrome and other browsers, but it was originally developed for Firefox, and this article will cover using Firefox and Firebug together. T his developer's add-on from Parakey, Inc., is licensed under a BSD license and is open source, free to use (see the license for full details).
For Network Monitoring, it is in a word, handy. You can't just use WireShark, but you are seeing "performance" problems in your environment. The real problem you are having though, is that you don't know what the root of the issue is based upon; Is there a network issue, is my browser at fault, is the database connecting or is there a code-interpretation issue somewhere?
Firebug is fantastic at resolving these types of issues. It helps you isolate and locate problems down to the specific steps of determining what code is taking longer than expected to respond, or is failing to respond. It not only analyzes response time for code, but services as well. If a database connection drops, or if a service does not respond - you will be notified within Firebug. If a call is made to a method that is not allowed - you will be notified. If something is undefined - you will be notified. Every error, warning, success or method being called is being tracked by the tool.
What is nice about it, is that it is a developer's tool and is allowed to be installed as a browser add-on. In order to get the most out of F ireb ug, I want to ensure that the script module and the console are both enabled within Firebug prior to using the tool in my monitoring activity. If you are unsure of how to do this, check the Get Firebug website Wiki to determine how this is accomplished.
To show you some of it's power, let's do some basic tasks and use Firebug to capture and monitor traffic when taking actions within Access Governance Suite. First, I am going to login as spadmin and then go to the Manage => Identity Correlation page. I want to create some scenarios that I know will fail, simply to show you how errors might be shown, and to show you that sometimes they will not present themselves in an obvious manner.
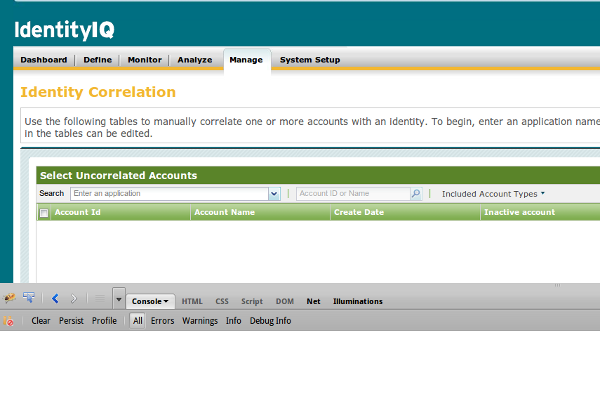
In my first screen capture, you will notice that I am logged in as spadmin and on the Manage => Identity Correlation page, and I have Firebug opened to the Console with the ALL parameter selected. This will display everything that occurs within the client (browser) as it communicates with the server for our review. Take a look at the screen capture below:
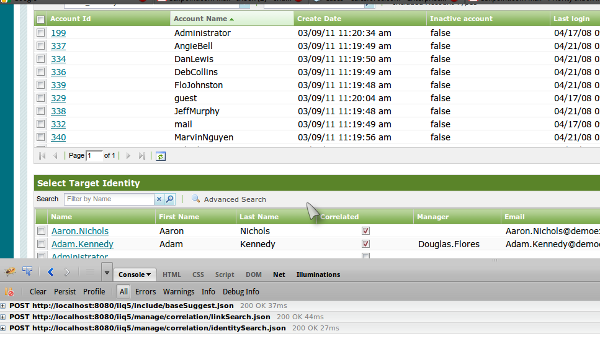
You will notice that the Firebug console is set to display all output when presented with input at this point. I begin by selecting an Application and all possible identities to perform correlation upon resulting in the screen capture below:
Note the POST commands showing in the Firebug console. If you drill down into each command, you will see the results from each command as it takes place between the client and the browser. That information exchange is being recorded in Firebug.
So, in order to show you something of value, I will need to generate an error of some sort, so why not do something that will definitely generate errors to show the result? Let's select a single account from the application (in this case DebCollins) as shown below:
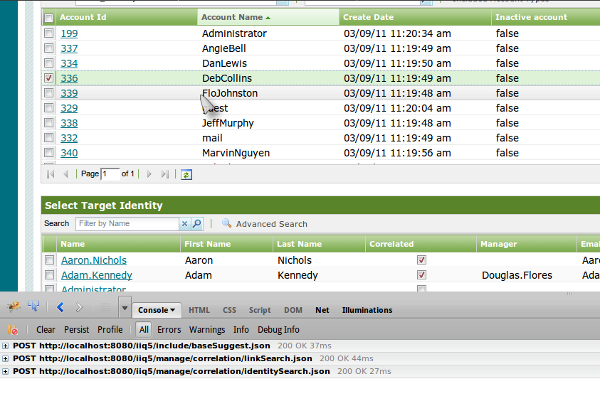
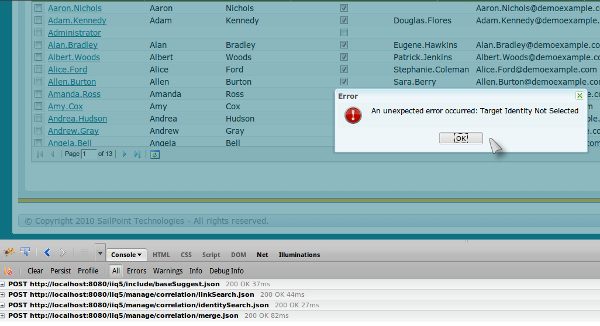
Now, let's do something forgetful and not select an identity to merge the account into as shown below:
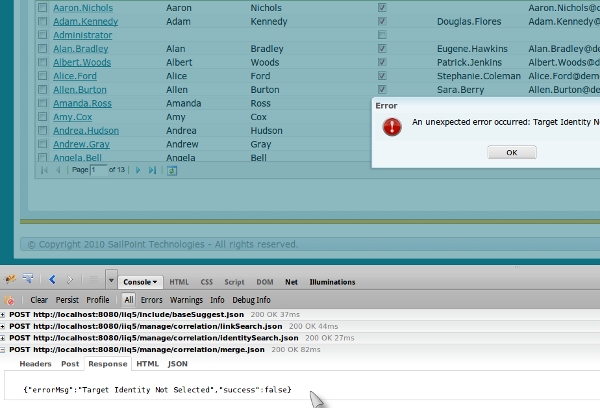
As expected - we generated an error within the browser - and it is clear why we received the error from this message: we did not select a target identity to merge the account into! However, Firebug does not (at first glance) to have captured the error? Not exactly, it did capture the error, you just have to expand the last call to see how the error was transferred and what was sent:
Note that the call itself is an error message, but it was successful in being transmitted, so this transmission was not an "error" necessarily in the sense that it succeeded in returning to the client in an expected manner. Therefore there was not a highlighted message in the error itself, and it does not appear to be a unintended or undefined output.
What would happen though if I tried to merge nothing into something? In other words, let's say I tried to merge nothing into a Target Identity, or I simply forget to select an account when trying to merge this into a Target Identity (this can occur, but it is usually due to an oversight or distraction), what would the result be? Let's take a look at that process.
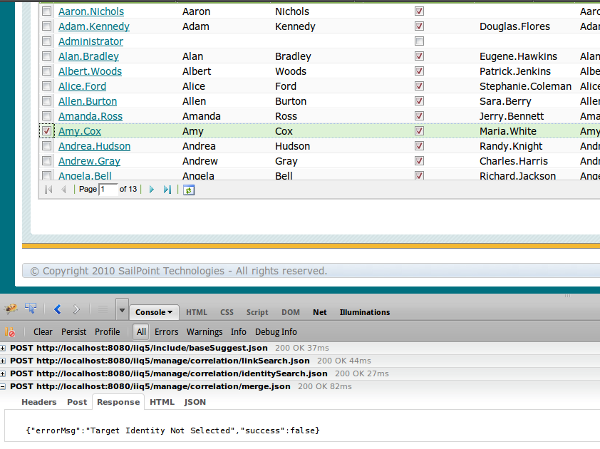
First, I remember that I need to merge an account for Amy Cox, but I forget to select her account item, or get distracted while doing so (someone calls without warning, an email arrives or there is a knock at my door - something distracts me). Let's see that screen shot below:
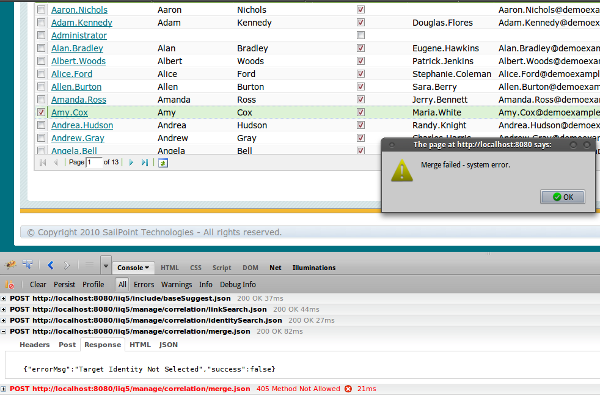
Next, I go ahead and click on that "Perform Merge" button, because I was not fully focused on my task at hand. If everything is working as it should, I should receive an error almost immediately as shown below:
Note the difference in this error message in both presentation to the client as well as presentation within Firebug. In Firebug - this error is presented in red, as this is an error in method. The code was interpreted as trying to do something it should not do and returned an HTTP 405 error code "Method Not Allowed."
Note that the actual message displayed to the client is "Merge failed - system error" - which is true in a sense - an attempt to merge nothing into the target identity has failed, because Access Governance Suite is unable to merge the account with nothing (I will avoid the discussions of becoming one with the great nothing and any philosophical arguments and schools of thought surrounding such ideas). The proper return of an HTTP error code (405) is derived as the browser sent across an incomplete POST command and therefore the method was not allowed.
Basically, this is a (very simplistic) deciphering of the conversation between the server, the client (browser) and the User.
Server: Ready for your command
Browser (to server): Okay, Please merge ¦.. with Amy.Cox
Server: ? I'm sorry - I can't merge ¦.. that is not allowed.
Browser (to User): Server has a problem - It failed to do what I asked.
User to ?: <snipped>
NOTE: The browser never tells the User that the problem was really trying to merge ¦.. (nothing) with an account (a silly thing to do, a simple error). However, our sleuth Firebug helps us interpret what really just happened in that conversation and what is going on within the code.
Browsers, by default, tend to want to please users, and may not always report everything correctly as they occur. Firebug however, can help you interpret signals, isolate issues and trace conversations. You can even use Firebug to time conversations if something is taking too long, but that's a topic for their Wiki. Consider using Firebug as a good troubleshooting tool to help assist you in locating issues that may be occurring within your environment though. It is a handy tool for your environment.
