Environment
Microsoft Windows Server 2008
Microsoft Windows Server 2003
Novell eDirectory 8.8 for Windows
Situation
eDirectory on Windows is unresponsive.
eDirectory on Windows crashes.
Allocation errors in the Application Event Logger.
Problems with eDirectory on Windows are often related to insufficient memory especially in a 32-bit environment. Conditions such as
- Allocating too much eDirectory static cache memory
- Other processes competing for resources within DHOST's address space
- High levels of LDAP traffic resulting in many short term memory allocations
- Not enough physical memory
These can all have an effect on how much memory is available to eDirectory.
Resolution
To both provide a baseline and\or determine if eDirectory is becoming unresponsive due to a lack of memory resources the following steps are recommended. Task manager does not accurately show how much memory eDirectory is using. This is due to Windows memory management. It is costly for the OS to reconsolidate all application-released memory back into the available pool. Instead, once released back to the OS the OS will not reduce the memory eDirectory is showing as used until another application requests it. Utilization can also be tracked this way by simply adding that counter to step 4d.
Windows 32 bit note: By default, a Windows 2003 or 2008 32 bit server will split the 4GB available into 2GB for the kernel and 2GB to user space. To allow eDirectory to use the maximum of 3GB that Windows 32-bit allows an application it is recommended to either change this default split, or better yet, move to 2008 and eDirectory 64-bit which removes most of these limitations.
On 2003 one adds the /GB startup switch (if using Enterprise or Datacenter). For 2008 32-bit, this is achieved using the "BCEDIT /set increaseUserVA 3072" command. for more information please refer to the following articles:
http://msdn.microsoft.com/en-us/library/aa366778.aspx
http://blogs.technet.com/b/askperf/archive/2007/02/23/memory-management-101.aspx
http://blogs.technet.com/b/askperf/archive/2007/03/23/memory-management-demystifying-3gb.aspx
http://blogs.technet.com/b/brad_rutkowski/archive/2006/10/03/hey-where-did-_2f00_3gb-go-in-longhorn-and-vista_3f00_.aspx
http://blogs.technet.com/b/askperf/archive/2007/02/23/memory-management-101.aspx
http://blogs.technet.com/b/askperf/archive/2007/03/23/memory-management-demystifying-3gb.aspx
http://blogs.technet.com/b/brad_rutkowski/archive/2006/10/03/hey-where-did-_2f00_3gb-go-in-longhorn-and-vista_3f00_.aspx
Monitoring eDirectory memory on Windows 2003
1. Bring up Perfmon. Select Start - Run - then type in "perfmon" to bring up the Performance Console.
2. Create a new log. Once in the Performance Console select Performance Logs and Alerts.
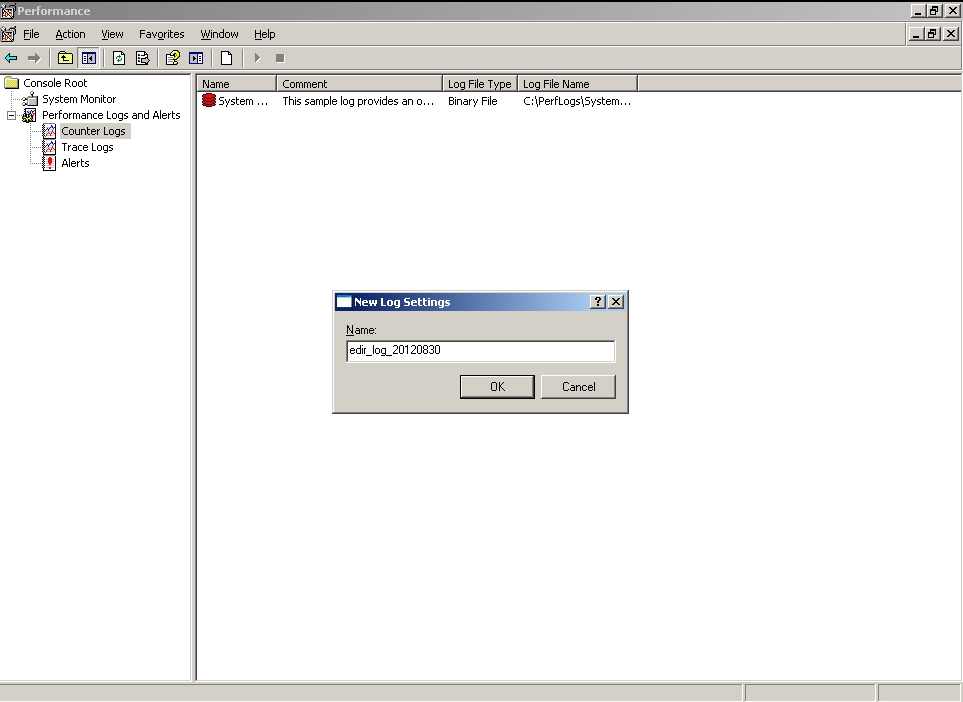
3. Right click on Counter logs, select New Log Settings, give the new log a descriptive name (IE., edir_log_20120830) and select OK.
4. Configure the log's settings. The next screen will show the log file properties beginning with its current path and filename.
Select Add Counters and make the following changes to the Add Counters dialog:
a. Leave Select counters from computer as is, pointing to this server
b. Change the Performance object to Process
c. For instances choose to Select instances from list and choose dhost.
d. For counters choose to Select counters from list and add the following:Private Bytes
Virtual Bytes
Handle Count
Threads
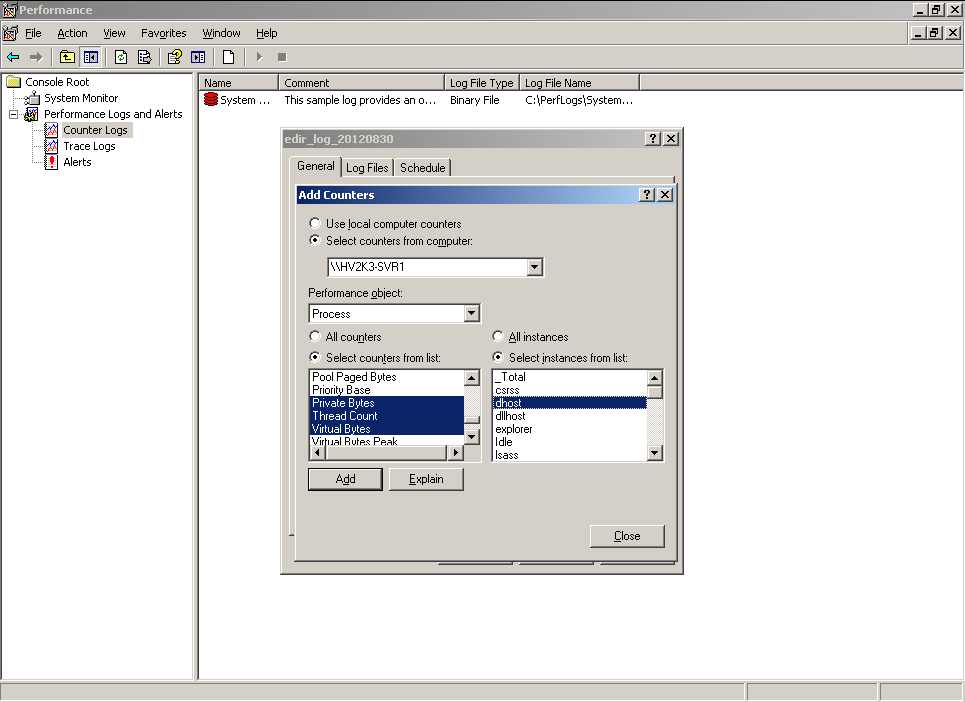
e. Either select all four counters or each individually then click on Add followed by Close.f. Select the appropriate sampling interval followed by OK. An interval of one hour is a good start if the tool must run over several days. The perfmon eDirectory log just created should now be running as indicated by a green icon in perfmon's Counter Logs list. The other tab options need not be changed. (NTS will want the file in binary format and to run immediately until manually stopped.)
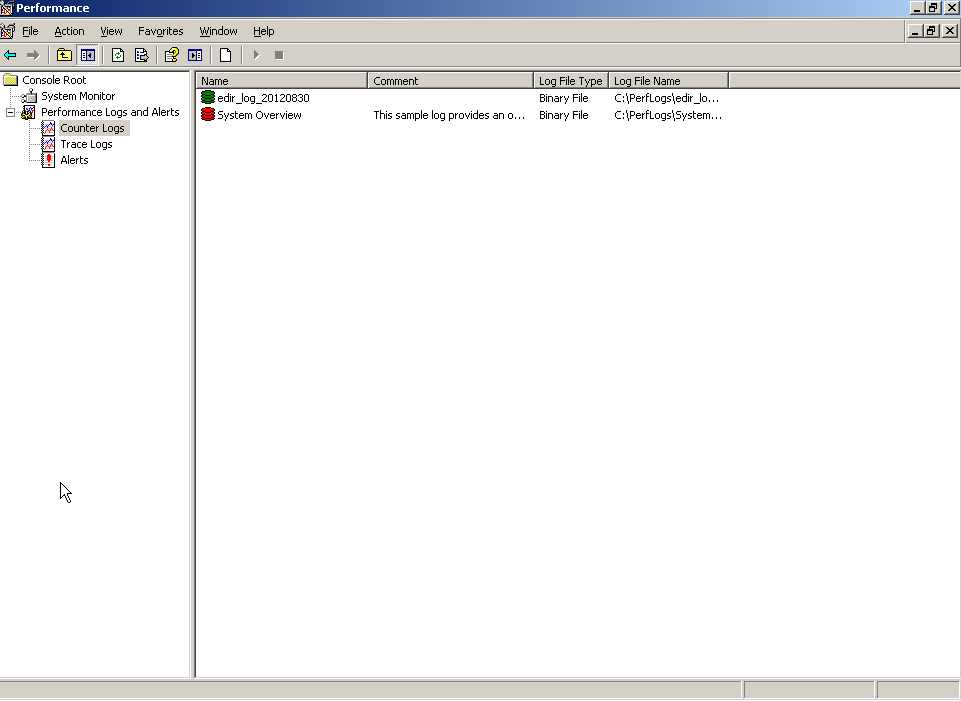
g. Once it has run the amount of time suggested by NTS, the logging can be ended by right clicking on the green icon of the running log and choosing Stop. The file(s) will, by default, be placed in the c:\PerflLogs directory Please zip and send the blg files to NTS for analysis if asked.
Monitoring eDirectory memory on Windows 2008
Performing this function on 2008 is very similar. The main difference is on 2003 server, one creates a log and sets its counters. On a 2008 server one creates a Performance Data Collector and adds counters to it.
1. Bring up Perfmon. Select Start then type in "perfmon.exe." to bring up the Performance Monitor Console.
2. Create a new Data Collector Set. Once in the Performance Console drill down to Performance - Data Collector Sets - User Defined.
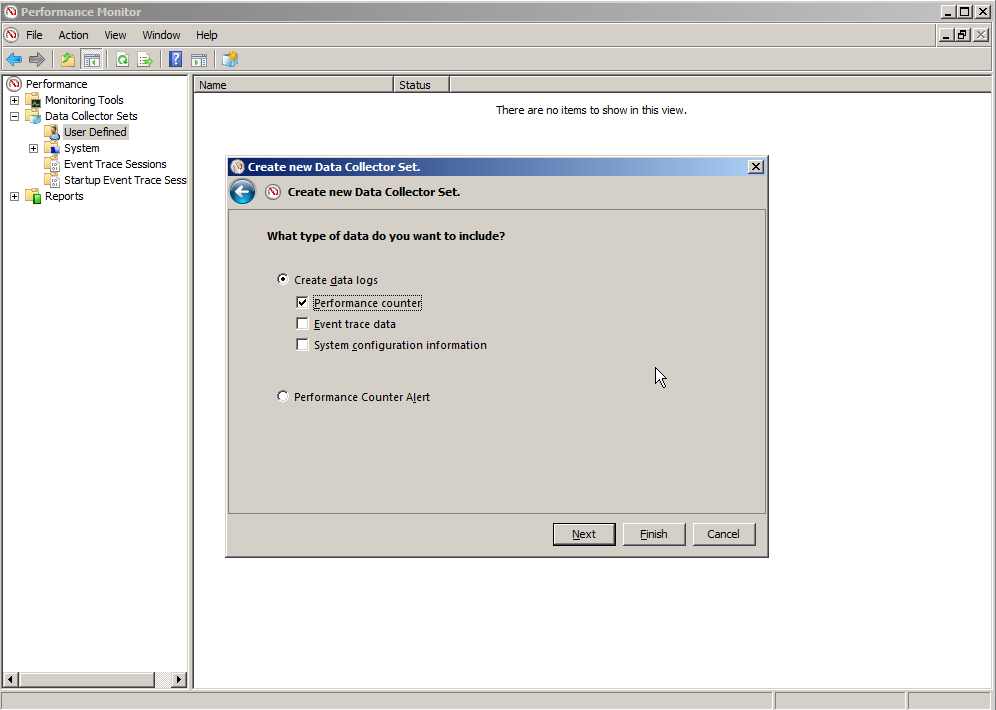
3. Right click on User Defined and select New - Data Collector Set and give the new collector a descriptive name (IE., edir_log_20120830), select to create manually then select Next.
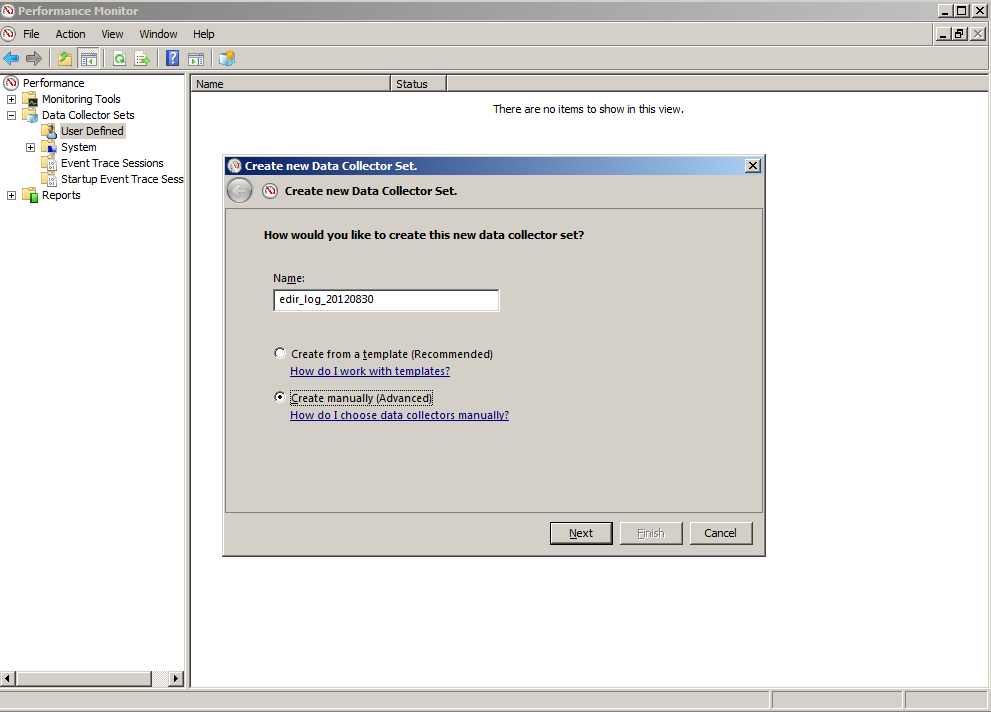
4. Configure the Collector Set parameters. Select to create data logs - Performance Counter.
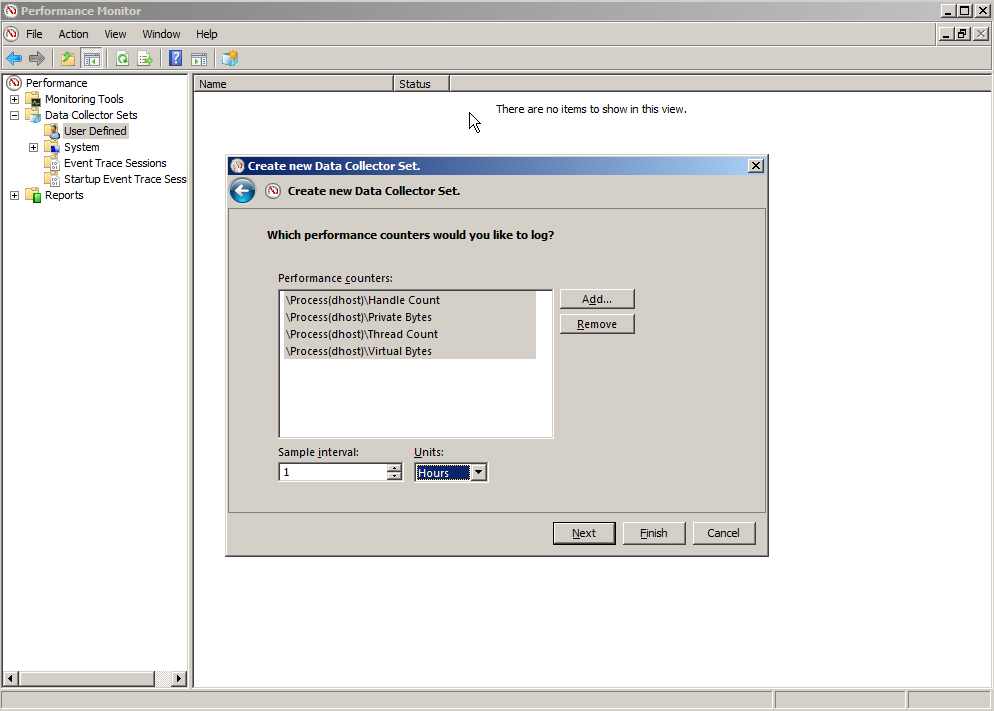
5. The next screen allows the selection of what Performance Counters we wish to log.
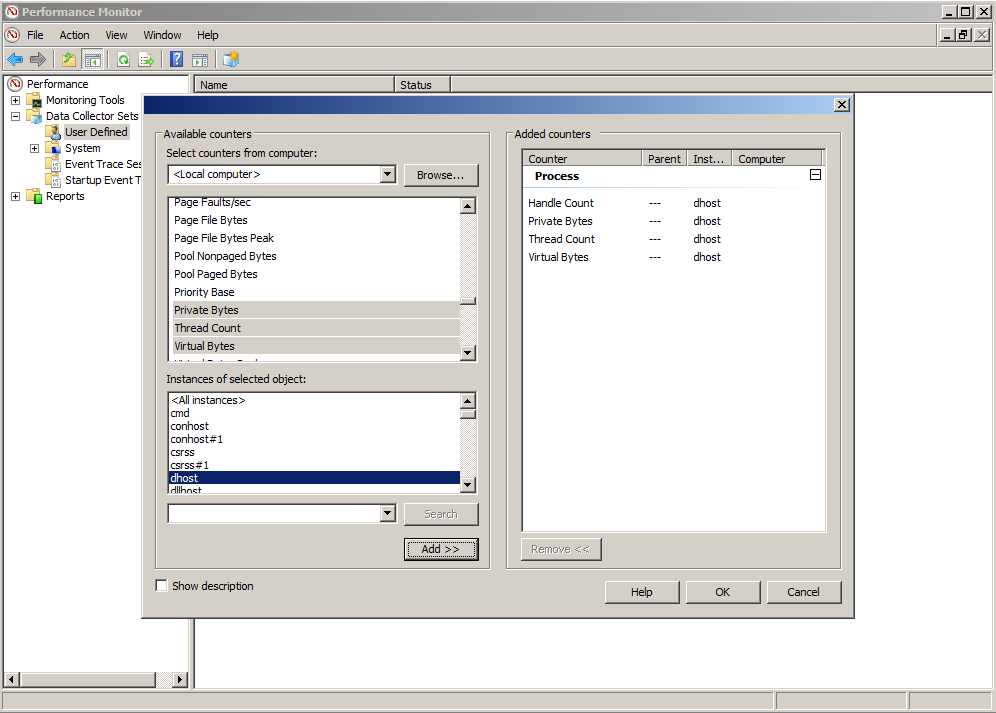
Select Add Counters and make the following changes to the Add Counters dialog:
a. Leave Select counters from computer as is, pointing to <Local computer>
b. Expand the Process Counterc. For the field, Instances of selected object - choose dhost.
d. Underneath the Process Counter choose the following:Handle CountPrivate Bytes
Virtual Bytes
Thread Count
e. Either select all four counters or each individually then click on Add followed by OK.
f. Select the appropriate sampling interval followed by selecting Next. An interval of one hour is a good start if the tool must run over several days.
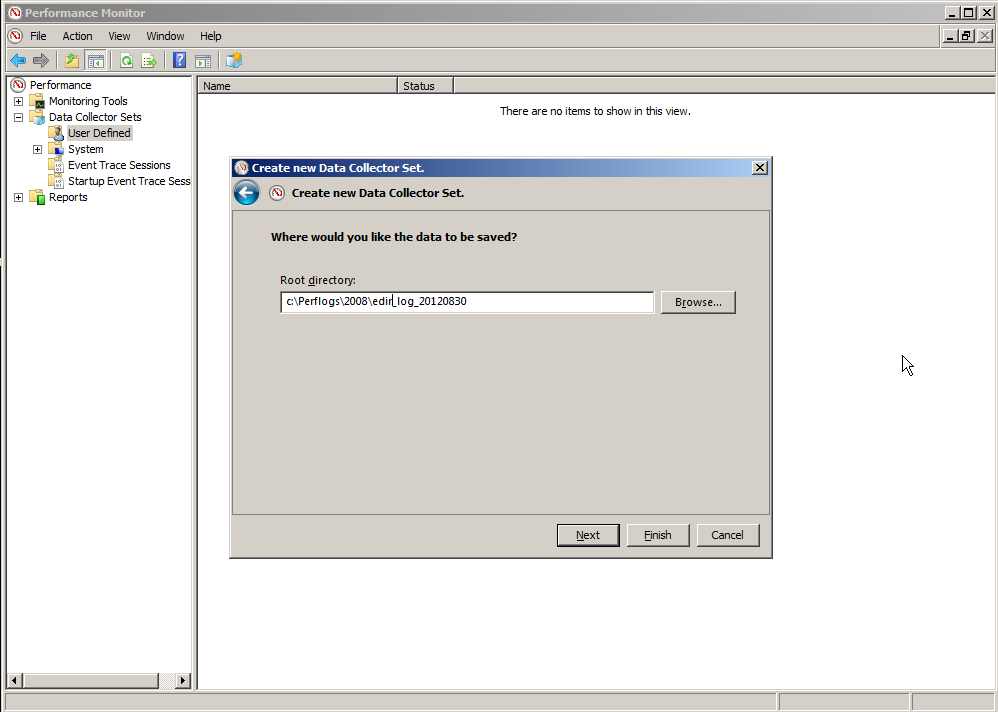
g. Next select the name and where to place the generated log then select Next . (IE:., c:\Perflogs\2008\edir_log_20120830.)
h. Choose to Save and close, followed by Finish.
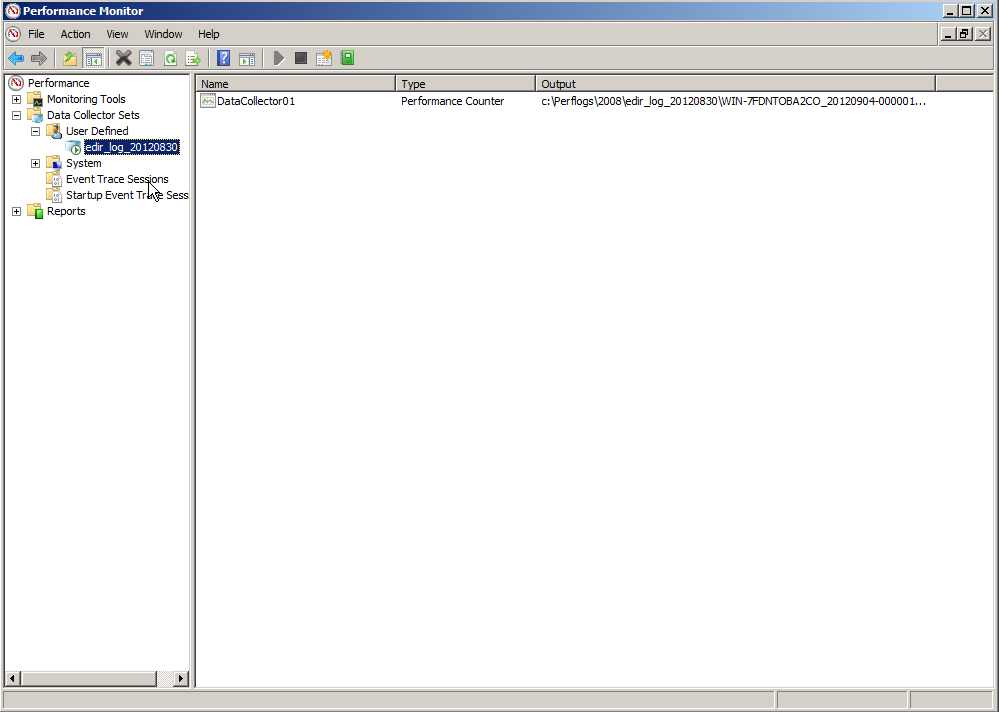
6. The Perfmon collector is now configured and awaiting a start command. To start it up, right click on the Collector previously created under the User Defined section and select start. While running a green right arrow can be seen on the Collector's icon. Once it has run the amount of time suggested by NTS, the logging can be ended by right clicking on the Collector and choosing Stop. The file(s) created can be found in the location specified in step 5g. Please zip and send the blg files to NTS for analysis if asked.
NOTES:
Perfmon binary logs can be read natively in another Windows' instance of perfmon. They can also be converted to CSV files using the relog utility so the historical information can be further analyzed in OpenOffice or Excel:
relog logfile.blg -f csv -o logfile.csv
this utility can also create new logs from old logs based on filtering criteria.
For more information please see:
Additional Information
Formerly known as TID# 10094816
Formerly known as TID# NOVL99109