Environment
Novell eDirectory 8.7.3.9 FTF2 for All Platforms
Novell eDirectory 8.8.1 FTF3 for All Platforms
Novell eDirectory 8.8.2 for All Platforms
Situation
Locks on the eDirectory database are a normal occurance that
must happen in order to write data into it. Due to the speed
with which it is able to obtain and release a lock and using its
builtin design of a single writer but multiple readers users
of eDirectory rarely are aware a lock has taken place.
However, there are certain circumstances whereby the time required
for a thread to obtain a lock can be excessive and affect
operations. This could be one of the following:
the server is overloaded with modify requests, a current lock
is taking to much time and the other write threads are queuing up,
misconfiguration, etc. The symptoms of excessive
locks can exhibit themselves in high utilization, slowness or
unresponsiveness to client requests and long login
times.
On NetWare often the Cool Solution NWMON utility was used to
identify whether an excessive database lock was the cause by
examining its main screen or, more often, allowing the utility to
log out these conditions. NWMON could also
help in identifying which process was holding the lock
for an extended amount of time. However, NWMON is only
available for NetWare.
Resolution
There is now a new feature in iMonitor to perform this
function. It has been added to eDirectory versions 8.7.3 SP9
FTF2, 8.8 SP1 FTF3 and the coming release of 8.8 SP2. If an
excessive database lock is suspected as the culprit for the
symptoms mentioned above or if Novell Support asks you to track
lock times and submit the logs from this utility then the procedure
outlined below will be a guide in setting up the diagnostic
logger in iMonitor to track long lock times.
1. Connect to iMonitor via a browser. For
instance, on Linux this would be https://x.x.x.x:8030/nds .
2. Once in iMonitor click on the Agent Configuration -
Diagnostic Logger links in the left side frame.
3. Once there a page will be displayed similar to
the following:
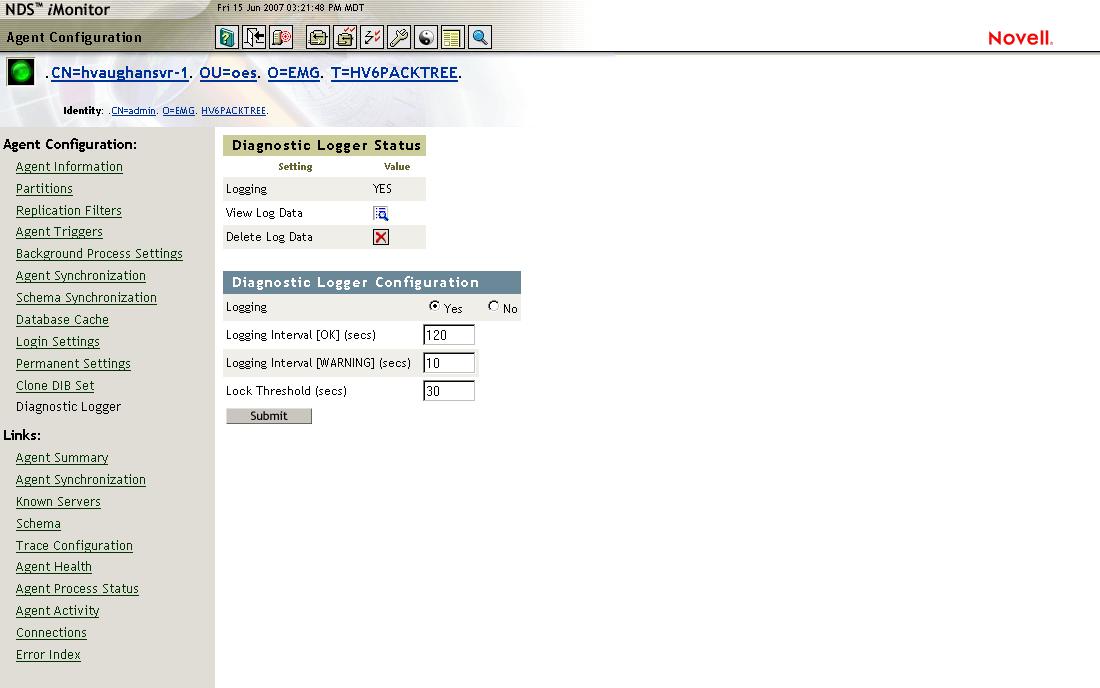
On this page the Diagnostic Logger Configuration settings
can be set. In this example logging has been turned on.
The threshold has been set to 30 seconds, the logging interval to
120 seconds and the logging interval for warnings is set to 10
seconds. This means iMonitor will consider any lock
greater than 30 seconds to be excessive. Until that threshold
is reached logging will take place every 120 seconds. When a
lock time goes over 30 seconds, logging will take place every 10
seconds until the lock for that particular process is
released. Press submit and the logger will start
running.
When the symptoms begin happening the log file needs to
be viewed in order to see if a excessive lock is
occuring. This can be done by clicking on the View Log
Data icon. Below is the log view screen:
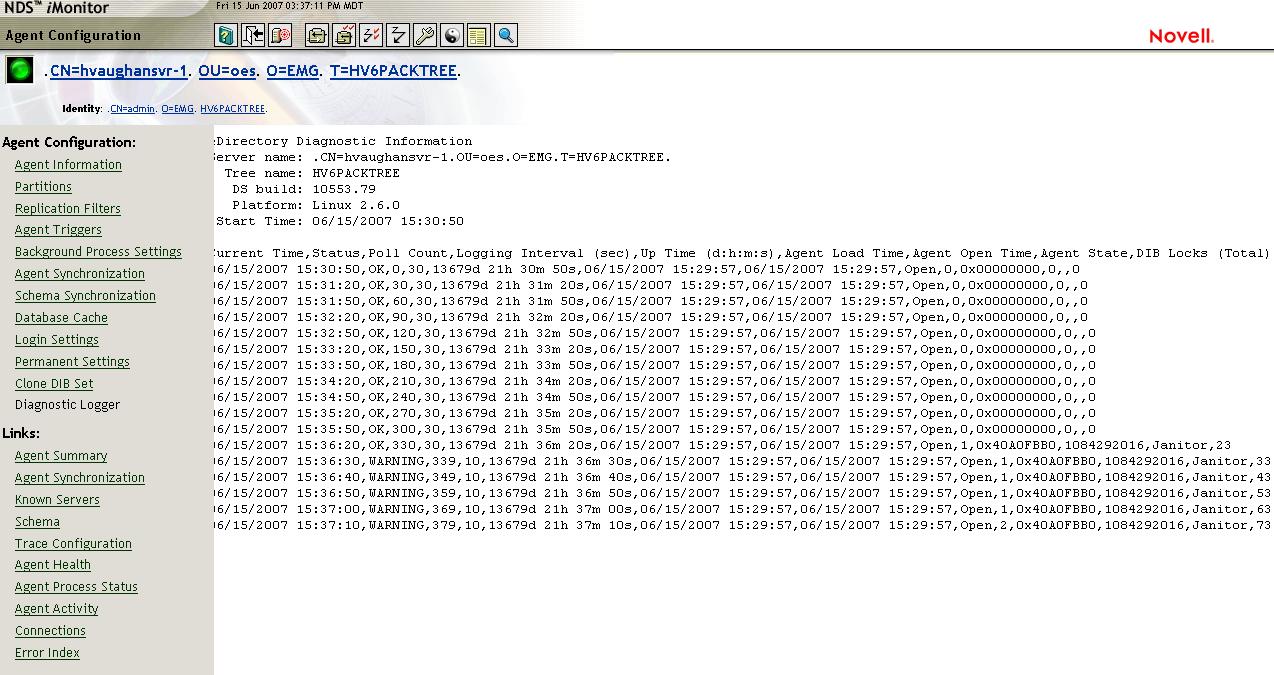
The output from the log shows an excessive lock has been found
according to the parameters set earlier. The data fields
do not line up well in iMonitor. The main values of
interest at this initial point are the following:
- threshold set for the lock time was reached, indicated
by the WARNING status.
- the last column shows the length of time the lock was
held
- the description of the thread causing the lock
- the date and time it occured.
The next step is to take the output file from the server and
import it into a spreadsheet for easier viewing. The log on
the server's local filesystem is called diaglog.csv and can be
found in the dib directory. This server is a Linux
server running eDirectory 8.7.3 so it can be found in the
/var/nds/dib directory.

Much better!
Column A shows the lock began on the 15th of June around 3:36
pm and ended at 3:41 pm. More significantly it ended on its
own since column E shows the server was not rebooted and column G
shows the daemon was never restarted. (The time display is
approximate and does not increment properly in this first
version.) Columns J and K show the thread's ID in hex and
decimal. These are not terribly useful on Linux since
there is no way to crossreference these to the threads found in a
core if one is available taken. Of more interest is column L
which shows that in this case the Janitor process was holding the
lock and held it for 323 seconds as indicated by column M.
This log will be very useful to Novell Support. If using
this functionality for a company's own investigation the
following questions might be asked:
1. Does the lock time always occur around the same time
of day?
2. What is happening in the environment during this
time?
3. What has changed in the environment?
4. Grab some dstrace output before the issue occurs to see
what activity leads up to the issue.
NOTE: It is important to be aware that currently after ds is restarted or the server is rebooted that the diagnostic logger settings will revert to off. An enhancement request has been entered to make this permanent if desired.
NOTE: It is important to be aware that currently after ds is restarted or the server is rebooted that the diagnostic logger settings will revert to off. An enhancement request has been entered to make this permanent if desired.