Environment
Novell Connectivity Products
Novell Open Enterprise Server (NetWare based)
Novell Small Business Suite 6.5
Novell Packet Scanner (pktscan)
Situation
Need to take a packet trace from a NetWare server
Need to take a network trace on a NetWare server
Want to configure pktscan to capture more data
Suspect network problems
Need to take a network trace on a NetWare server
Want to configure pktscan to capture more data
Suspect network problems
Resolution
- Download and install PKTSCAN
- Search Novell's patches site for pktscan
- Download and extract PKTSCAN.NLM, copy it to sys:\system
- Load PKTSCAN on the server
- Launch and log in to Remote Manager
(http://your.ip.addr.here:8008)
- In the left panel, towards the bottom, should be "Server Management". Expand this option.
- Click on Packet Scanner
At this point, you could do a scan. The default maximum size of the capture is 16 MB. If you have enough free memory, it's good to increase this to the maximum that PKTSCAN will allow.
- Click Configure -> Configure Profiles -> Create New Profile
- Give the profile a meaningful name, such as "BigCapture"
- Increase the Buffer Size to the Maximum (currently 128 MB)
- You may want to change the state to "Stop" -- see the
additional notes section of this TID.
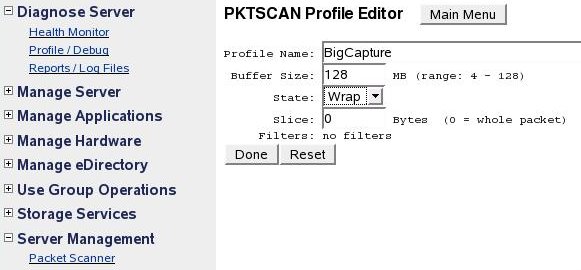
- Click Done
- Click the radio button next to your newly created profile, then choose Done.
- You will need to restart PKTSCAN before the change takes effect. A message should be displayed stating this. Unload and reload pktscan.
- Click "Start Capture" to begin taking the trace
- The "Start Capture" button turns into "Stop Capture" while the trace is being done. Click this button to stop the trace.
- Click "Retrieve Packets" to download the packet trace. If
you're working with Novell, zip the file and send it to your
engineer according to their instructions.
Additional Information
You do not have to use Remote Manager to configure / use
pktscan.nlm. You can take a trace from the server
console. This is documented in other TIDs.
Regarding the Profile State -- If the capture goes beyond the maximum and the state is set to "wrap", it will overwrite the initial packets captured. You may not care if the initial data is overwritten, if you are waiting for a particular problem to occur. On the other hand, sometimes the you need to be able to see what happens when you start something. If you are working with Novell on a problem, ask your engineer what they prefer this setting to be.
Regarding the Profile State -- If the capture goes beyond the maximum and the state is set to "wrap", it will overwrite the initial packets captured. You may not care if the initial data is overwritten, if you are waiting for a particular problem to occur. On the other hand, sometimes the you need to be able to see what happens when you start something. If you are working with Novell on a problem, ask your engineer what they prefer this setting to be.